The US Dollar was trading lower against a basket of global currencies with the US Dollar Index (USDX) trading 0.73% lower. Strong economic data from the Euro zone pushed the common currency higher and thus affected the Dollar. Persisting uncertainty about the US tax reform also pressured the US Dollar. The Russian Ruble continued to fall and was 1.79% weaker against the Dollar on Tuesday as a bond auction from the Russian central bank could fill its bond sale to only 11% of the total offered amount.
Oil traded significantly lower with the WTI oil losing the biggest amount in a day since June as a report by the International Energy Agency (IEA) lowered global oil demand and at the same time predicted that the United States could become the major oil producer within a decade. Higher oil stockpiles in the US, according to the American Petroleum Institute additionally pressured the price of oil.
Gold traded higher as the Dollar weakened and US Treasury yields were lower.
US equity indices closed slightly lower amid uncertainty surrounding the tax reform and the end of the earning season on Wall Street.
Bitcoin trade slightly higher on Tuesday but still significantly lower than the previous week, while the competing currency Bitcoin Cash which saw its prices peak over the weekend further retreated. The CME Group’s chairman confirmed on Tuesday its commitment to launch Bitcoin futures soon as he mentioned December as a possible date to start trading.
On Wednesday France publishes inflation numbers and the European Union its global trade statistics. The United Kingdom will publish its unemployment and average earnings statistics. From the US we expect mortgage market, business conditions, business inventories, retail sales and inflation data. On Wednesday the Energy Information Administration (EIA) publishes oil stockpile numbers. On Thursday in the Asian trading session Australia releases its jobless figures.
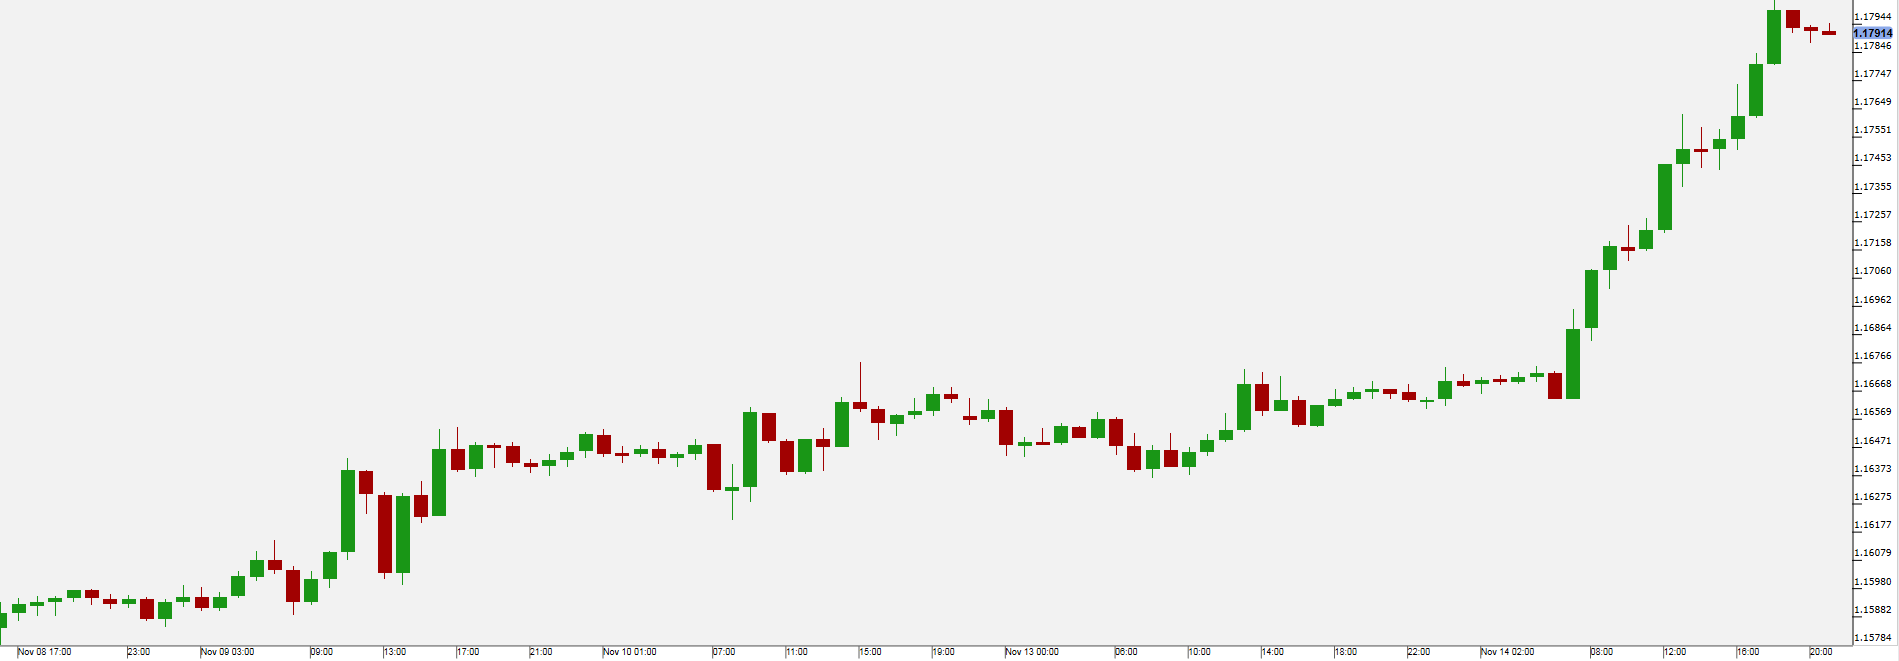
The rise in the EUR/USD [i] was primarily attributed to strong economic data from the Euro zone. German (2.8% vs. 2.4% expected) and Italian (1.8% vs. 1.7% expected) GDP figures helped push the common currency against the Dollar to a 2.5 week high on Tuesday as ECB President Draghi, among other central bank chiefs hinted at an end of the “easy money” policies.
On Wednesday France publishes inflation numbers and the European Union its global trade statistics. From the US we expect mortgage market, business conditions, business inventories, retail sales and inflation data.

Pivot: 1.1725
Support: 1.1725 1.17 1.1675
Resistance: 1.183 1.185 1.188
Scenario 1: long positions above 1.1725 with targets at 1.1830 & 1.1850 in extension.
Scenario 2: below 1.1725 look for further downside with 1.1700 & 1.1675 as targets.
Comment: the RSI is bullish and calls for further upside.
Gold
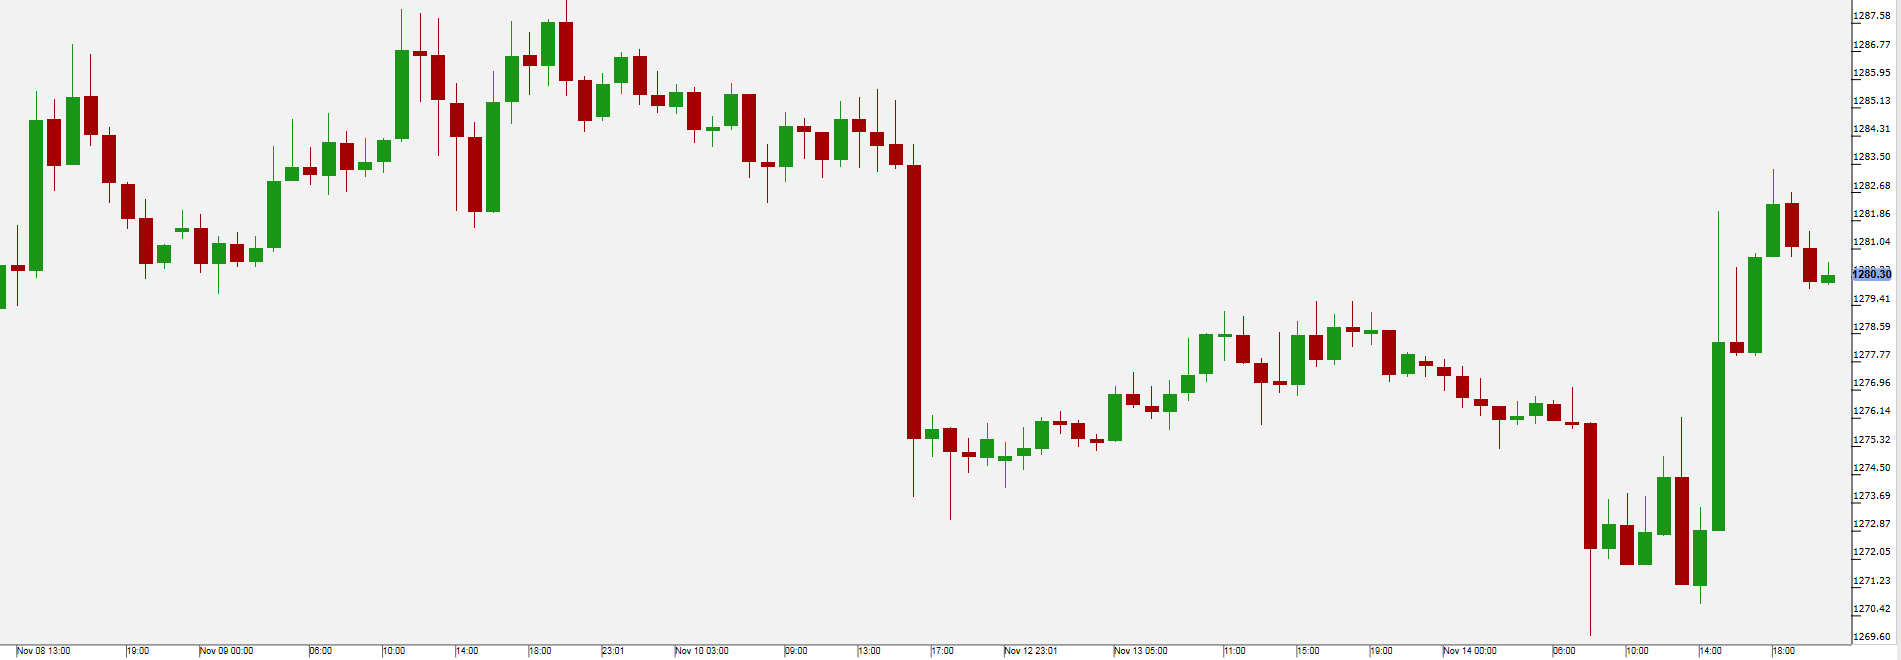
Gold [i] was trading higher as future exchanges showed higher amounts of bullish bets on the safe haven precious metal. This comes after a plunge in prices on Friday, following an extremely high order volume flooding the exchanges within just ten minutes. The weaker Dollar as well as falling Treasury yields further contributed to the upside.
Fundamental economic data in the US, especially on inflation, to be released on Wednesday could further influence the markets.

Pivot: 1276.5
Support: 1276.5 1270.75 1266
Resistance: 1285.5 1288.25 1291
Scenario 1: long positions above 1276.50 with targets at 1285.50 & 1288.25 in extension.
Scenario 2: below 1276.50 look for further downside with 1270.75 & 1266.00 as targets.
Comment: the RSI is bullish and calls for further upside.
WTI Oil
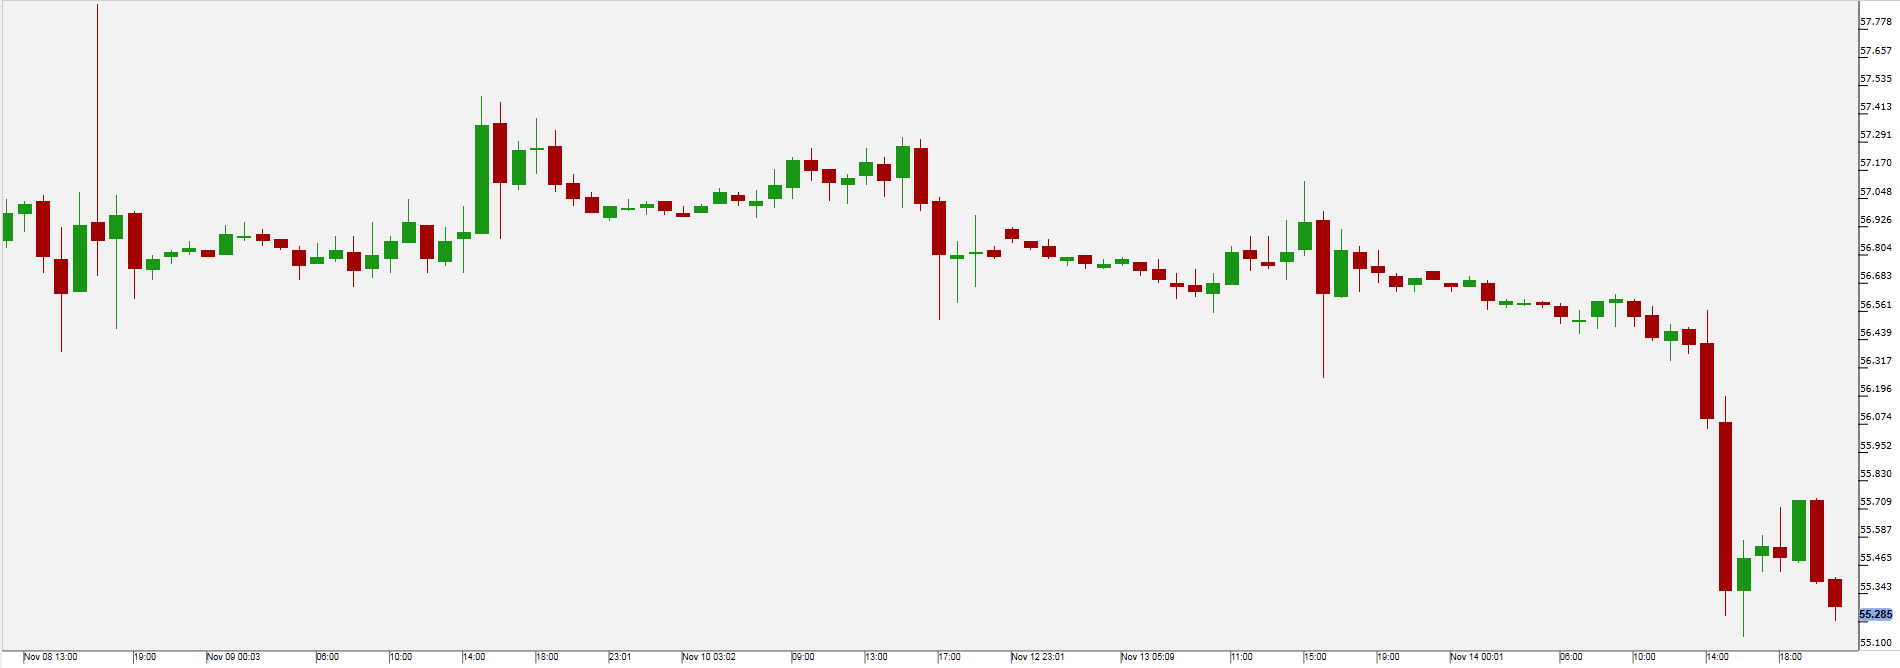
WTI oil [i] lost the biggest absolute amount on Tuesday in a day since June as a report from the International Energy Agency (IEA), which sees the United States becoming the major oil producer and overtaking Saudi-Arabia within a decade according to some estimates. The IEA’s estimate that the oil demand this year would rise by only 0.1 million barrel per day (bpd) and 1.5 million in the next year, below previous estimates, put oil further under pressure. The rising crude oil stocks in the US according to the American Petroleum Institute with stockpiles up 6.5 million barrels (forecasted down 2.2 million barrels) added to the oversupply worries.
On Wednesday the Energy Information Administration (EIA) publishes oil stockpile numbers.

Pivot: 56.25
Support: 55.03 54.4 53.75
Resistance: 56.25 57.15 57.5
Scenario 1: short positions below 56.25 with targets at 55.03 & 54.40 in extension.
Scenario 2: above 56.25 look for further upside with 57.15 & 57.50 as targets.
Comment: the RSI is bearish and calls for further decline.
US 500
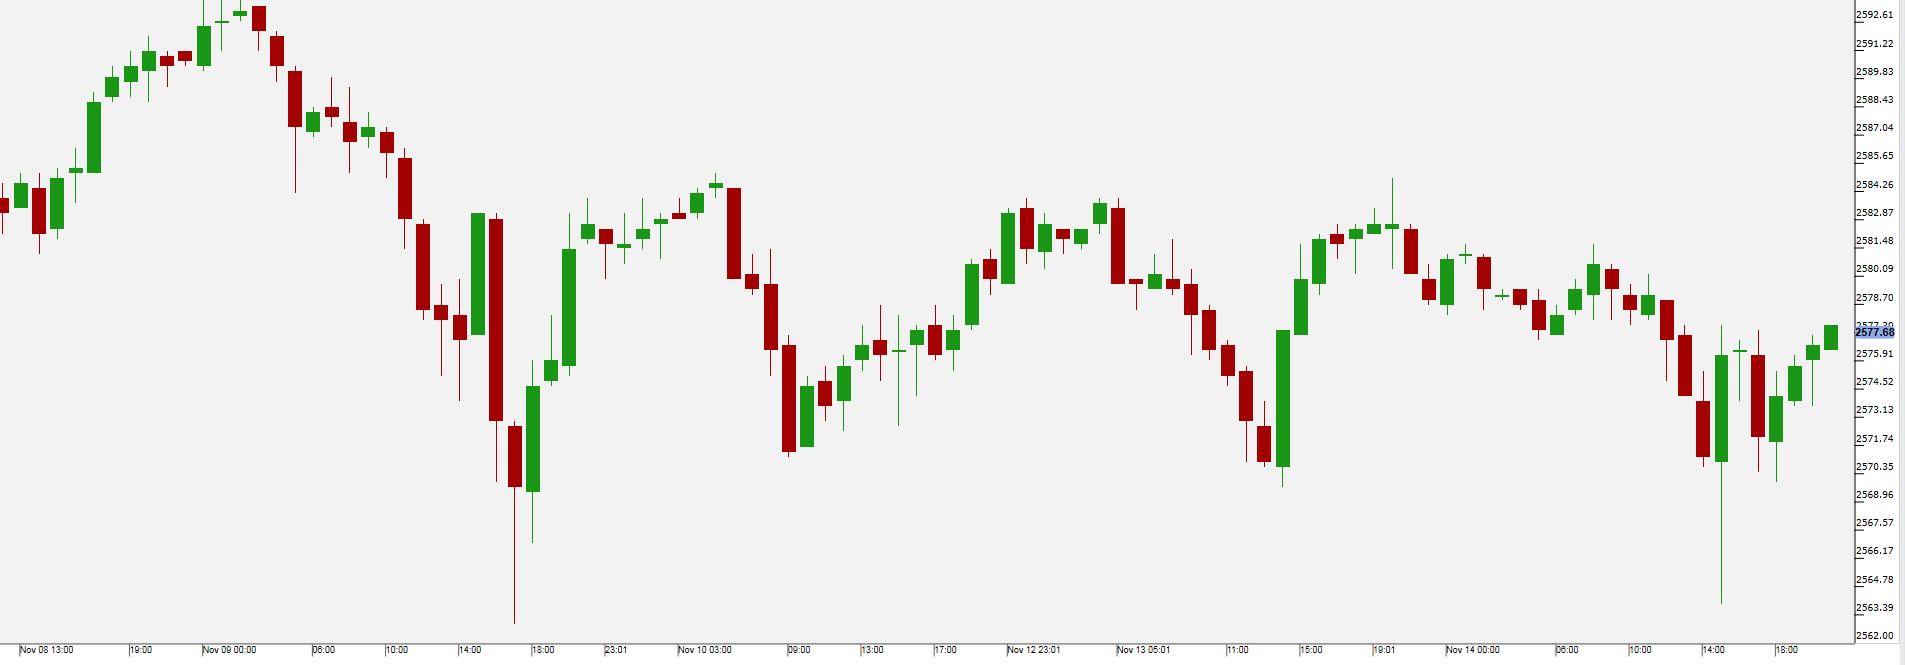
Equity indices [i] traded lower on Tuesday as much about the implementation of the US tax reform is still undecided, as Senate Republicans added amendments regarding “Obamacare” in the proposed legislation. Continued losses by General Electric (NYSE:GE) (-6.14%) and falling Apple (NASDAQ:AAPL) stock prices (-1.43%) also put pressure on index performance. Utilities were the best performing stocks of the day (US Utilities ETF +1.26%), while Energy (US Energy ETF (NYSE:XLE) -1.65%) and Biotech (US Biotech ETF -1.59%) were the worst performers.
While the earning season is almost over this week Cisco will publish its earnings on Wednesday after market close and Wal-Mart (NYSE:WMT) on Thursday before markets open. Inflation, business condition and inventories as well retail sales data coming in on Wednesday could further move the markets.

Pivot: 2568
Support: 2568 2563 2556
Resistance: 2585.5 2589.5 2594.75
Scenario 1: long positions above 2568.00 with targets at 2585.50 & 2589.50 in extension.
Scenario 2: below 2568.00 look for further downside with 2563.00 & 2556.00 as targets.
Comment: the RSI is bullish and calls for further upside.
