Back in 1999, low inflation and fabulous headline unemployment (<5%) warranted a Federal Reserve overnight lending rate of 5.0%. Today, low inflation and desirable headline unemployment (<5%) come with $3.75 trillion in electronic money credits still on the central bank’s balance sheet and a Fed Funds Rate of a mere 1.25%. That is 375 basis points lower than it was with similar economic fundamentals less than two decades ago, not to mention a whole lot of “electronic money printing” since the financial crisis in 2008.
A great many economists agree that the excesses leading into the 2008 financial crisis occurred, in large part, due to keeping interest rates too low for too long. Leverage through exceptionally easy access to low borrowing costs became rampant in residential real estate.
This time around, though, a decade of near-zero rate policy and trillions in asset purchases via quantitative easing (QE) have yet to result in asset price disaster or economic catastrophe. On the contrary. Keeping rates much lower for much longer have enabled the U.S. government to borrow trillions more than it might otherwise have, companies to saddle their balance sheets with never-before-seen debt levels, and consumers to supplement stagnant wages with an assortment of credit (e.g., credit cards, auto, student, home equity, other, etc.).
Some might argue that the loan quality is not as bad as it was when “liar loans” and “negative am” ruled the roost. There is some truth in that. At this juncture, the consequences of corporate excess have only been felt in the energy and retail sectors.
On the other hand, similar signs of silliness have resurfaced. For instance, before the financial crisis in 2008, leveraged loans became disproportionately large relative to other types of corporate loans. Here in 2017? The speculative reach for higher yields alongside corporate willingness to borrow has once again led to a disproportionate mix of offerings.
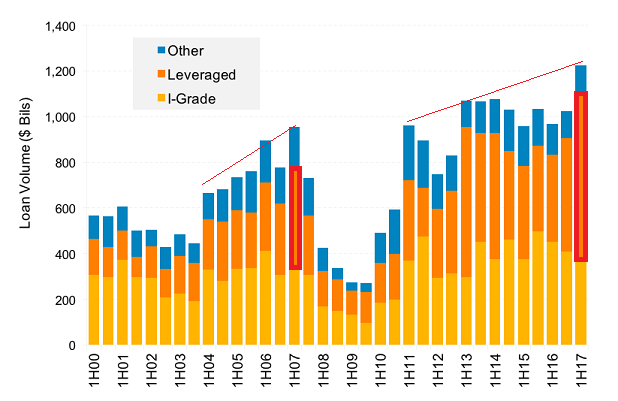
This is just one of the phenomena associated with artificially suppressed yields and ultra-easy access to cheap credit. Another? The swapping of stock liability for debt liability that has left corporations more leveraged than they’ve ever been in history.
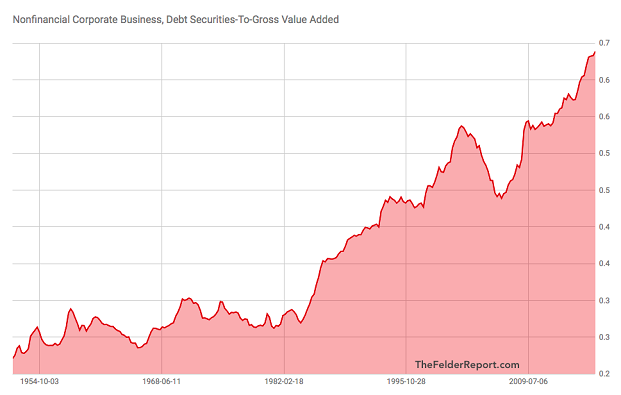
Perhaps ironically, the stock-for-debt swap only tells half the story. When public corporations used the debt dollars to remove stock liability from their books, the reduction in share count made stocks more scarce. A lack of supply coupled with flat demand or increased demand contribute to price appreciation.
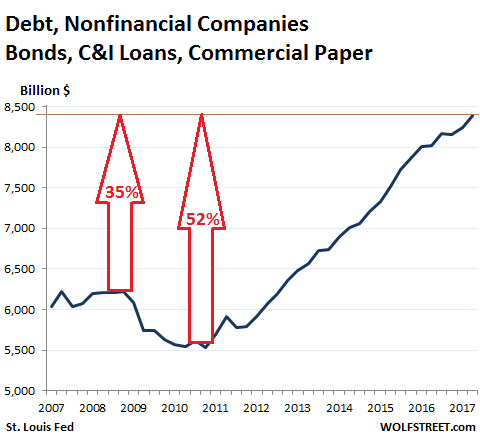
Another way to look at what has transpired is to compare corporate debt percentage increases to earnings per share gains and stock price appreciation. Since the end of the first quarter of 2011, corporate borrowing has surged by approximately 50%. That helped GAAP-based earnings per share (EPS) climb 28%.
Did stocks only rise 28%? Hardly. Stock prices have rocketed 88% over the six-and-a-half years since. In other words, debt helped stock prices a whole lot more than corporate profitability.
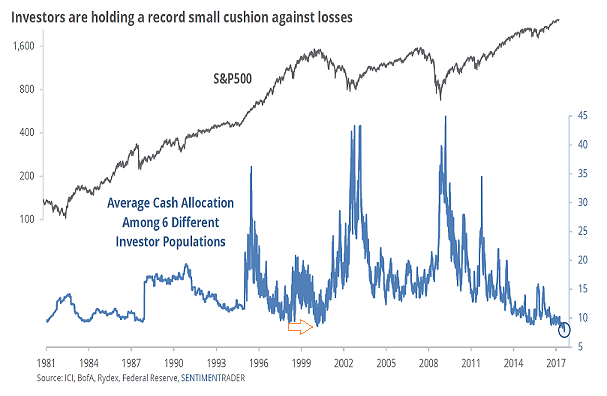
Rightly or wrongly, the investment community is showing little fear. Record low cash levels solidify the likelihood that there is plenty of comfort placing so much faith in stocks and other higher-yielding instruments. When a larger percentage of money is in the safety of cash, it tends to be associated with risk aversion; when nearly all of it is ‘working,’ that tends to be a sign of risk-seeking.
Would this sentiment indicator alone imply that a bear market for riskier debt and/or stocks is imminent? No. Nevertheless, a quick peek back at the cash levels associated with 1999-2000 hint at a comparable complacency.
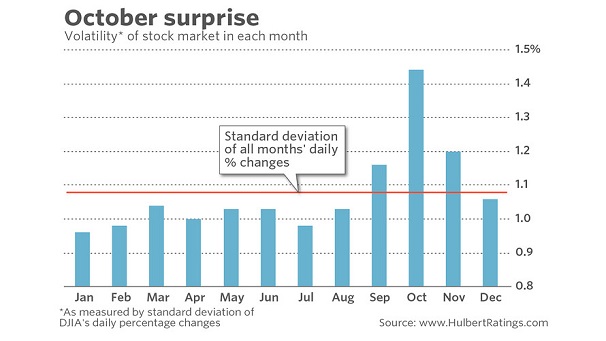
Still, complacency may unwind a bit in the month ahead. The CBOE VIX Volatility Index (VIX) tends to elevate in the month of October.
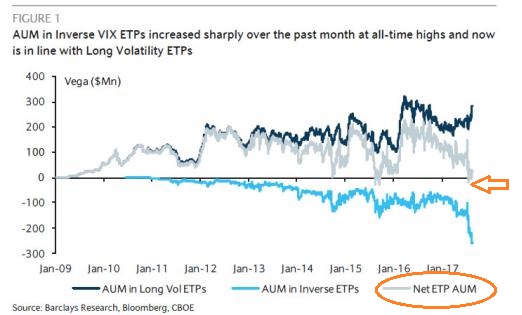
Equally compelling? A whole lot of people in 2017 have been pouring money into Inverse VIX exchange-traded products to short volatility. (See the light blue line below.) Right now, though, there are as many dollars speculating in leveraged long VIX exchange-traded products as there are in the short camp. (See the silver line below.) This has not really been the case since the last stock market correction of 10%-plus in January of 2016 — 20-plus months ago.
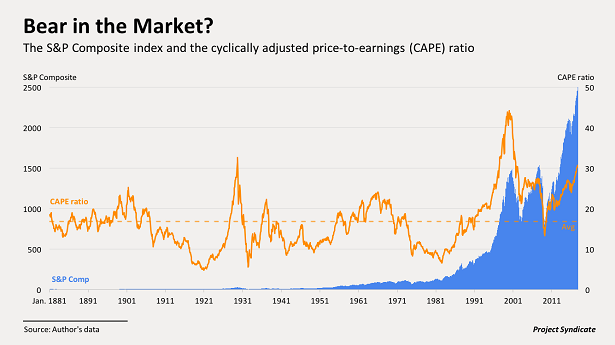
Some money may be ‘betting’ that stretched valuations require a reality check. The cyclically adjusted price-to-earnings ratio (PE10) has only looked worse in 1929 and 2000. In fact, Robert Shiller recently said that “…the U.S. stock market looks a lot like it did at the peaks before most of the country’s 13 previous markets.”
Granted, valuations like Shiller’s PE10 cannot predict the timing of a bear. On the flip side, according to Shiller, higher-than-average real earnings growth and lower-than-average stock price volatility occurred in every year leading up to a bear market’s origin. In other words, exceedingly high market valuations coupled with lower-than-average volatility and higher-than-average real earnings growth came before all 13 of the 20%-plus price depreciation episodes.
Should you think about playing it safer? That is a personal choice. I downshifted risk from 70% stock/30% income to 50% stock/25% income/25% cash equivalents a number of years ago.
What I would say is that I prefer growth at a reasonable price. Companies like Gilead (NASDAQ:GILD) and Apple (NASDAQ:AAPL) at 10x and 13x operating cash flow respectively are priced reasonably for the growth provided. In contrast, I may or may not like the businesses of Facebook (NASDAQ:FB) and Amazon (NASDAQ:AMZN). Yet 26x or 27x or 28x operating cash flow? Most, if not all, future growth may be ‘priced in’ already. Other than their presence in a core index fund holding, it is hard to ‘justify’ growth at ridiculous prices.
Disclosure Statement: ETF Expert is a web log (“blog”) that makes the world of ETFs easier to understand. Gary Gordon, MS, CFP is the president of Pacific Park Financial, Inc., a Registered Investment Adviser with the SEC. Gary Gordon, Pacific Park Financial, Inc., and/or its clients may hold positions in the ETFs, mutual funds, and/or any investment asset mentioned above. The commentary does not constitute individualized investment advice. The opinions offered herein are not personalized recommendations to buy, sell or hold securities. At times, issuers of exchange-traded products compensate Pacific Park Financial, Inc. or its subsidiaries for advertising at the ETF Expert website. ETF Expert content is created independently of any advertising relationship.
