I asked my vice president at Pacific Park Financial if he thought that anything might wobble the stock market. Rob said, “Extra-terrestrials could invade the planet. That MIGHT send the Dow down 0.4% for a few hours in the middle of the day.”
“I disagree,” I countered. “If aliens visit Earth, they will share secrets on how to travel faster than the speed of light in exchange for shares of Amazon (NASDAQ:AMZN).”
“They’ll want bitcoin,” Rob said matter-of-factly. “Cryptocurrencies are very rare outside our solar system.”
Good humor notwithstanding, the Dow has set more than 40 record highs in 2017. The story is very similar for the S&P 500 and NASDAQ. Clearly, stocks have maintained strong buying demand since the November election.
Prior to the election, however, the cessation of Federal Reserve balance-sheet expansion coupled with extremely high stock valuations warranted a slight reduction in risk. Consider the reality that when the first round of quantitative easing ended (QE1), U.S. stocks depreciated 17%. Shortly after QE2 finished, in conjunction with Congressional gamesmanship stateside and euro-zone dysfunction abroad, the S&P 500 plummeted 19%.
Even after the Fed settled its final asset purchase using electronic dollar credits with open-ended QE3 in late December of 2014, stocks remained skittish for 22 months. There were 10%-plus corrections in August of 2015 and January 2016. Right up to the November 2016 election, the S&P 500 had spent close to two years around the 2075 level.
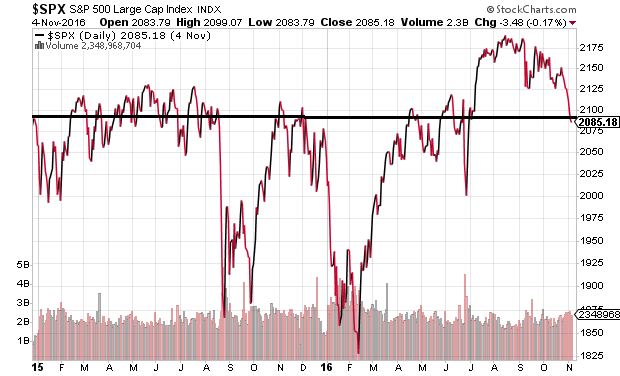
Up until November of 2016, our late December 2014 decision to downshift from 70%–equity–30%–income to 50%–equity–25%–income–25% cash equivalents had proven venerable. Then came a number of game changers. First, the election of Trump forced the investing world to rethink its assumptions about the corporate benefits of his presidency. After all, wouldn’t a tax code overhaul combined with infrastructure spending and regulatory reform be a net positive for businesses?
Second, Fed quantitative easing had been replaced, even surpassed, by $200 billion in monthly QE by central banks around the globe (e.g., European Central Bank, Bank of Japan, Swiss National Bank, Bank of England, etc.). Admittedly, I underestimated the impact of global QE’s ability to prop up domestic asset prices in the absence of greater Federal Reserve participation.
It follows that the initial ‘Trump bump’ alongside $200 billion in monthly liquidity injections have helped to push the S&P 500 up 20% since the election. And since the election 320 days ago, the popular benchmark has not even pulled back a token 3%. That is the second longest “non-movement” streak in the history of U.S. stocks.
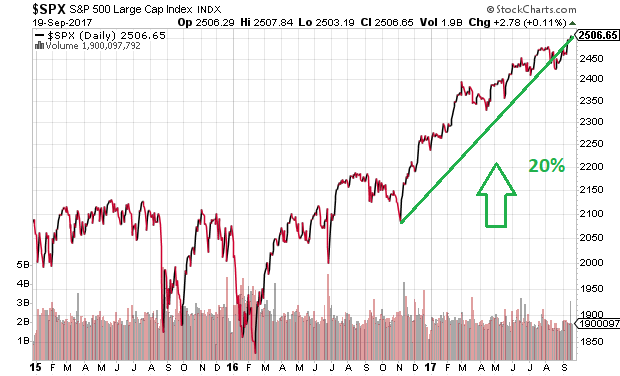
It has not mattered that the Fed stopped creating new electronic dollar credits. Nor has the credit cycle slowdown, geopolitical grandstanding, Congressional impasse, natural disasters, the demise of big name retailers or the decline in job growth shaken the stock tree.
Having downshifted from our target tactical allocation (70/30) to a more defensive posture (50/25/25) with our retiree and near-retiree client base, a few readers have boldly proclaimed that we are missing out. If a life-long process of investing stopped at this specific wrinkle in time, then yes… we missed a ‘skosh’ of the upside. Specifically, a 70/30 allocation of VTI/LQD has gained 22% versus a 17% gain for the less risky allocation of 50/25/25 VTI/GSY over the two-year, nine month period.
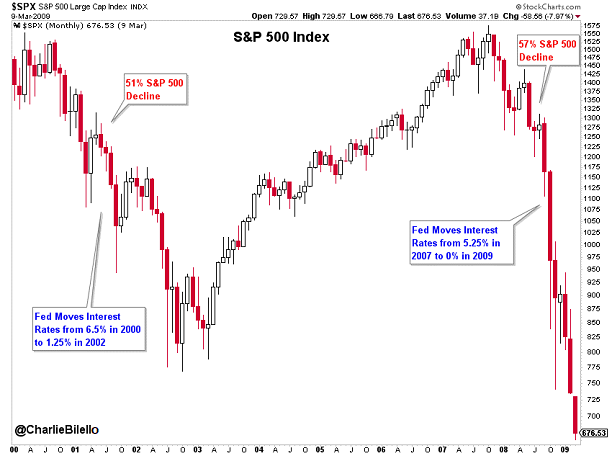
On the flip side, investing is an ongoing process. I was quite willing to forgo a portion of the performance chasing in 1999 to sidestep the bulk of the 2000-2002 bear market mauling. Equally critical? We were less stressed by the financial collapse in 2008-2009 when our discipline led us to downshift to 30% stock, 20% investment grade income and 50% cash equivalents. It is worth noting that when the tech bubble burst (2000) and when the real estate balloon imploded (2008), the central bank of the United States (a.k.a. “Fed”) did not have the ability to stem the reversal of stock market fortune.
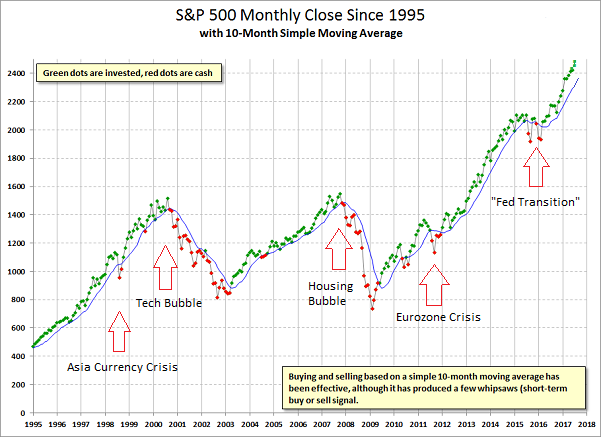
There are a variety of successful investing disciplines. Most, however, involve buying some assets at lower prices, which requires having some cash on hand to acquire assets at lower prices. We are most assertive in early bull market stages (2009-2014), defensive in the later stages (2015 to present) and capital preservation advocates when the closing price on the 10-month SMA breaks down. In this manner, we raise cash over bull-bear cycles to be in a position to acquire assets in the earliest stages.
Granted, a technical breakdown can happen for a variety of different reasons. Yet selloffs tend to be deeper if and when exorbitant valuations and excessive market leverage are present.
The most common arguments against my more defensive posture today include: (1) Low interest rates ‘justify’ high stock prices, and (2) There’s no catalyst or recession in sight. Let me address each of these notions one at a time.
A. Low Interest Rates ‘Justify’ High Stock Prices. Lower interest rates may warrant higher stock prices in a vacuum. However, stock assets do not morph into risk-free assets when the former’s earnings yield (earnings per share divided by price) exceeds the yield on comparable treasuries. One would have purchased stocks in 1980 before the 1980-1982 bear (-27%). Worse yet, one would have been misled prior to the financial crisis mauling when the S&P 500 forfeited more than half of its value (-57%).
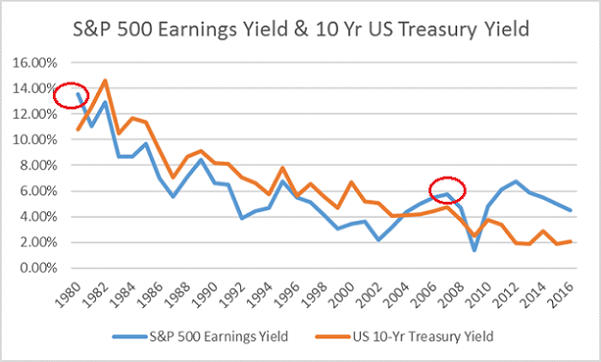
In a similar vein, some of the strongest bull markets in history occurred when the 10-year yield was higher than the stock earnings yield. From 1982 to 2000, the 10-year yield was higher than the the S&P 500 earnings yield. An investor following a competing asset approach would have been discouraged from adding stock exposure in one of the best secular bulls ever. From December of 1982 through August of 1987, stocks rocketed 229%; they catapulted 582% between 12/1987 and 3/2000.
What about using dividend yields instead? Stocks served up juicier dividend percentages than 10-year Treasury yields for 30 years between 1928 and 1958. A competing asset approach would have failed the investor who loaded up on equities prior to bears in 1929-1932 (-86%), 1937-1938 (-49%), 1938-1939 (-23%), 1939-1942 (-40%), 1946-1947 (-23%) and 1956-1957 (-22%).
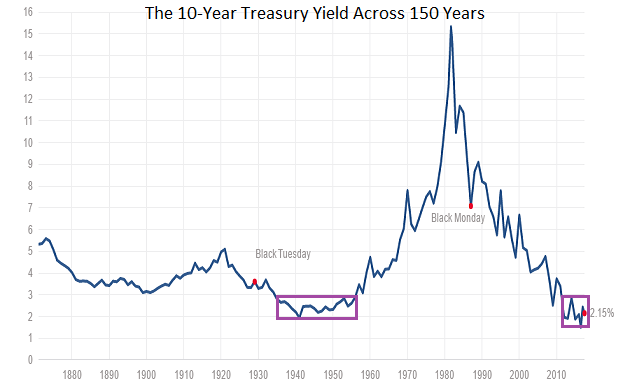
B. There’s No Catalyst Or Recession In Sight. There may not be an obvious trigger for overvalued assets like stocks, bonds and real estate. Then again, there was no obvious catalyst prior to the tech bubble bursting in March of 2000. In the rear-view mirror, we may point to the government’s antitrust case against Microsoft (NASDAQ:MSFT) or the Fed tightening that occurred toward the end of that month. In reality? An obvious catalyst was not present… only dot-com stupidity that buckled when it was good-n-ready.
Keep in mind, the NASDAQ lost 50% of its value by the time the 3/2001 recession began; it free-fell 65% by the time the brightest minds at the National Bureau of Economic Research (NBER) acknowledged the 3/2001 recession’s inception in the 4th quarter of 2001.
“Okay, well, a catalyst may not be recognizable until after the fact,” you concede. “But aren’t recessions or fear of recessions always a factor?” Not always. In fact, nearly half of all bear markets have been non-recessionary.
Since 1950 alone, we have seen non-recession 20%-plus drops in 1962, 1966, 1978 and 1987. We have also seen non-recession drops that do not get the full benefit of the bear title (e.g., 1998’s Asian currency crisis/Long Term Capital Management, 2011’s euro-zone, etc.), yet reached the 20% threshold via intra-day price movement and/or ’rounding.’
I am not saying that catalysts are irrelevant or that they may not be lurking. Quantitative tightening (QT) by the Fed, albeit exceptionally modest in scope, may change investor sentiment. Equally worthy of note? The downtrend in buybacks places added pressure on a market that has relied so heavily on corporate share purchases to prop up stock prices.
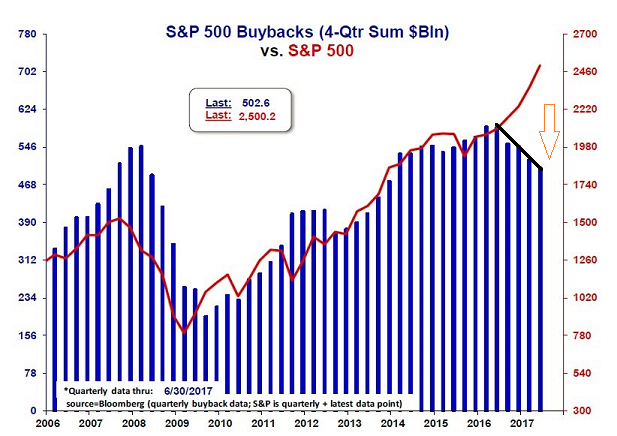
I am saying that a reduction in risk prior to a definitive ‘get out’ signal is appropriate. In a life-long process like investing, you are not ‘wrong’ if you’re not ‘long’ the stock market enough. You can participate with less risk when performance chasers insist that the 2nd longest bull market in history is in its infancy.
In truth, how ‘right’ you are during an up period will not be the thing that secures your standard of living. What really counts? How ‘right’ you are during the down part of a bull-bear cycle.
Regardless, readers should pay particular attention to the monthly close of the 10-month moving average. A break below the trendline warrants unique consideration for risk management. More often than not, a breach represents a shift in sentiment toward risk aversion; frequently, the event will offer you a premier opportunity to avoid a sizable chunk of painful price depreciation.
Disclosure Statement: ETF Expert is a web log (“blog”) that makes the world of ETFs easier to understand. Gary Gordon, MS, CFP is the president of Pacific Park Financial, Inc., a Registered Investment Adviser with the SEC. Gary Gordon, Pacific Park Financial, Inc., and/or its clients may hold positions in the ETFs, mutual funds, and/or any investment asset mentioned above. The commentary does not constitute individualized investment advice. The opinions offered herein are not personalized recommendations to buy, sell or hold securities. At times, issuers of exchange-traded products compensate Pacific Park Financial, Inc. or its subsidiaries for advertising at the ETF Expert website. ETF Expert content is created independently of any advertising relationship.
