Stock market today: S&P 500 climbs as ongoing AI-led rebound pushes tech higher

It was an interesting week in the stock market, with plenty of fear and greed to go around. Same as it ever was, right? As we analyze emotions and behavior they seem to parallel the price action in markets. Excessive greed pushes prices ever higher, We saw new highs this week in names like Amazon (NASDAQ:AMZN) and Google (NASDAQ:GOOGL), while all of the most prominent indices at some point hit record highs during the week.
As prices continue to rise volatility shrinks and the perception about market action becomes more 'predictable', and that could be troublesome. Anyone who tries to predict market action and behavior has certainly seen his share of losses - especially if it was down. Oh, we have seen downside over the years, but the longer term trend has been higher as the moves lower have been steep, sharp and quick.
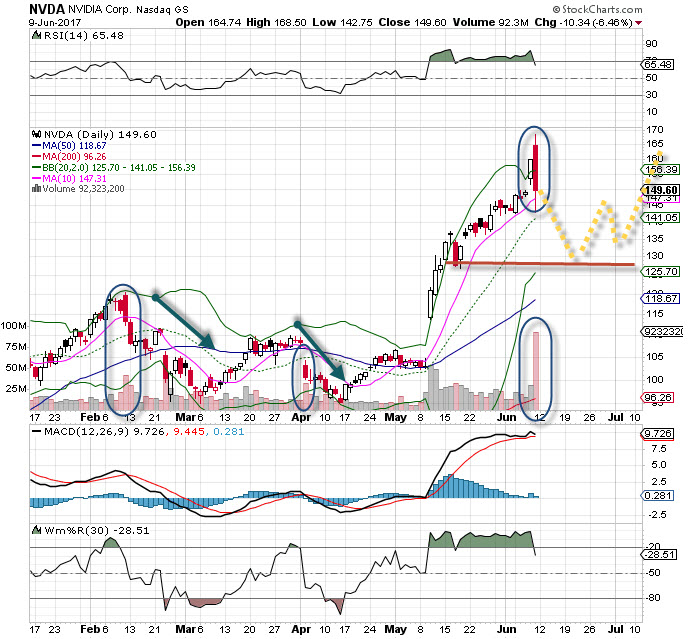
As we analyze price patterns we see behavior show up in recognizable patterns. Let's study the chart of recent high flyer NVIDIA (NASDAQ:NVDA). This stock was the top mover in the SPX 500 last year, up a stunning 300%. Many believed those days were behind it and most likely the stock was going to head sideways for an extended period. The stock hit new all time highs last week and pushed much higher than anyone would have expected. But as we can see from the daily chart, at least in 2017 there have been a few interruptions, and we have just seen another if the previous pattern plays out again.
Earlier this year, NVIDIA encountered two nasty selling days on heavy volume, and as we would expect there was followthrough to the downside. These followed sharp moves to the upside. Those trying to catch a falling knife were bloodied and beaten up by not waiting for the selling to subside. Prices did eventually rise however, and this last move from the 102 area in May up to 167 was just stunning.
But look at the poor action June 9 and we can see the setup for more downside first before the stock may head back up. Clearly the fear was evident by the extreme selling and massive turnover. Higher price levels were rejected and when that happened the floodgates opened and sellers hit the bid very easily. This follows the pattern of behavior of sellers in previous price breaks, the odds and probabilities favor more downside here.
While the exact pattern the stock may follow is a guess, we can discern from the chart where support lies, at the recent breakout level, around the 130 price zone. This was a place buyers were aggressive. This would be about 15% lower than the close last Friday, and would be an area of interest IF price stops its decline.
Bottom line, follow the patterns of charts to key in on areas of interest, as these patterns are indicative of human behavior, fear and greed.