USD/JPY broke down to its lowest level in 15 months, falling under 107 to test the all-important trendline support - extending from summer 2016. Is the yen too high for Japan’s struggling economy? Will the Bank of Japan intervene and try to slow the pace of the yen’s strengthening? Will it work?
Unsustainable Asset Purchases
Despite having weak inflation (at only 0.9%), Japan’s economy is on the ascent in terms of GDP growth, retail sales, consumer sentiment and corporate profits. This only increases the possibility that the Bank of Japan finally considers tapering its decade-old policy of asset purchases, which is distorting the equity and bond markets.
This policy is unsustainable. Through its annual purchases of 80 trillion yen in government bonds, the Bank of Japan owns over 11% of all government debt. And through its purchases of Japanese stocks, it owns 71% of all Japanese equity exchange-traded funds, acting as the largest holder in 55 firms of the nation’s bellwether Nikkei 225 index.
As the world’s major central banks shift towards tighter monetary policies, Japan’s central bank remains the farthest behind. This also means that it faces the scope of policy normalization i.e. reducing asset purchases, whose impact must be rising bond yields.
Dwindling Carry-Trade
It is for the above reason that the Japanese yen has strengthened despite the broad advance of global bond yields. Over the past 10 years, markets have grown accustomed to the yen-carry trade, driving the yen lower during improved risk appetite and rising bond yields abroad, as Japanese investors chase returns overseas due to ultra low or no yields on most financial instruments at home.
Increased Hedging
The role of Japanese insurance companies and pension funds in slowing the carry trade has been crucial over the past year—especially against the USD. These investors, who directed hundreds of billions of dollars in US-denominated assets have begun raising their hedge against the risk of their interest earnings losing value when converted back to yen. The rise in the hedge ratio of Japanese funds and insurance companies is perhaps the most significant and least discussed phenomenon in current yen strength.
Yen’s Trade Weighted Index
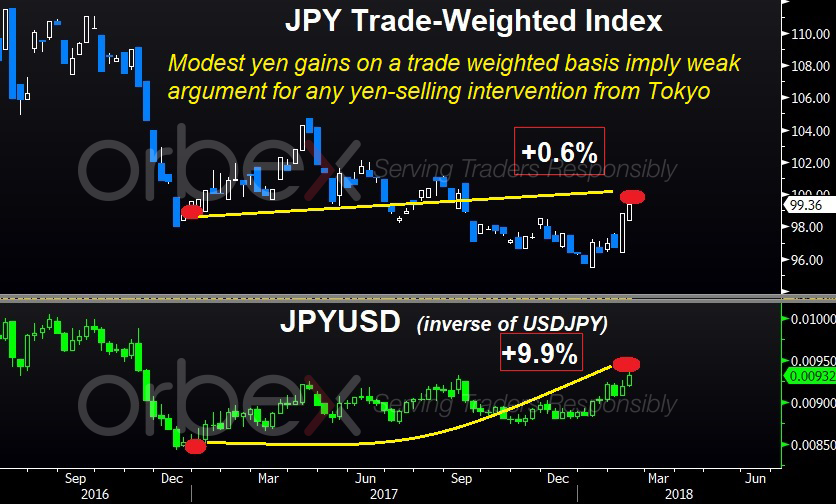
In order to determine what part of the decline in USD/JPY was driven by yen strength rather than USD weakness, it is more appropriate to analyse the yen’s trade-weighted index (provided by the Bank of Japan) for a more accurate view on the currency’s secular performance. The above charts indicate that the yen gained 10% against USD since the start of 2017, while rising by less than 1.0% in trade-weighted terms over the same period.
From this we can conclude that any jawboning from the Bank of Japan would be of little use. Yen declines resulting from interventionist remarks can be considered as a buying opportunity. Assuming that 102 on a trade-weighted basis serves as the next target, 101 would be the path of least resistance in USD/JPY spot basis.
