After the Facebook (FB) face plant, the first thing to emphasize about this potential near-term opportunity in Research in Motion (RIMM) is its high-risk, high-reward nature for a near-term pop in the context of a long-term bearish background.
Put otherwise, this is not for the faint of heart and a multiple-day closing confirmation is preferred on a pattern that could take RIMM higher by more than 20% this year.
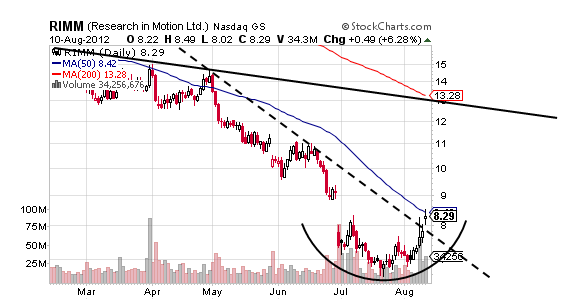
The pattern in question is a Rounding Bottom that confirms at $8.32 for a target just north of $10 while a possible Island Reversal offers a target closer to $11 and this latter technical aspect requires RIMM to gap up to at least its confirming level at $8.83 and a possible event that would likely take RIMM much higher on that gap up.
Supporting both possibilities right now is the fact that RIMM has started to reverse the near-term portion of its downtrend as demonstrated by today’s close above the dashed trendline.
Should RIMM close back below that trendline at about $7.80 and then dropping, its Rounding Bottom needs to be ignored unless it is followed by a strong move above its confirmation at the aforementioned $8.32.
And this is the key aspect around this near-term bullish opportunity in RIMM: closing confirmation above $8.32 is required.
Below $8.32, there is not a real Rounding Bottom in RIMM to consider, but above $8.32 and there is a Rounding Bottom on the table but with the long-term monthly chart on the following page showing why this is such a high risk trade.
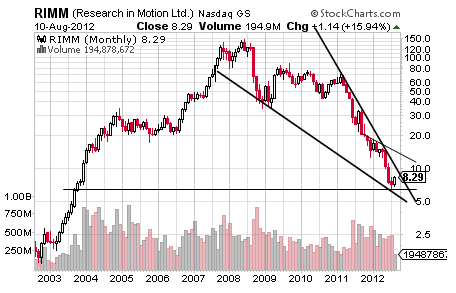
Before going to an advanced form of the long-term charts that are causing people at this time to call me a bear – as in RIMM is providing an early glimpse at what all of those other top-heavy and hugely bearish charts will do over time with timing admittedly not my strong point – let’s focus on the positive and that is for a potential pop of 20% or more in RIMM in the near-term. This Rounding Bottom looks quite decent even though RIMM may trade sideways slightly between about $7.80 and confirmation at $8.32 before it confirms decidedly.
All of this is a good reason to wait not only for confirmation on a closing basis but also to have very tight stops in place and a point that is well taken in the context of the aforementioned long-term preview of the bearish nightmare to come in equities of all stripes and colors. 
Interestingly, after Friday’s monster move, this chart actually has a ray of hope it did not have Thursday but that ray is thin so let’s not give it too much attention except for noting that RIMM has found precarious support as shown by the lightly marked horizontal line and that this thing should bounce big at some point on a bullish Falling Wedge.
Is that time now? Who knows and the only way to entertain its possibility to the smallest degree is if RIMM crosses above the top trendline marked in the daily chart that is marked in stubby form above at about $13 and more safely its 200 DMA.
The importance of RIMM’s closing above that year-long trendline is emphasized by the fact that a touch to it would start to create a bearish Descending Triangle while a close above it gives reason to think that the Falling Wedge as marked presently has a shot of taking RIMM much higher to a target that would sound so ridiculous around RIMM’s current positioning that it is not even worth mentioning. Okay, its $70 at a minimum and now you know why it sounds ridiculous.
Not only is it ridiculous, but it seems highly unlikely of having any shot of working with no shot of working below the 200 DMA.
What does have a shot of working, though, is a high-risk Rounding Bottom in RIMM.
- English (UK)
- English (India)
- English (Canada)
- English (Australia)
- English (South Africa)
- English (Philippines)
- English (Nigeria)
- Deutsch
- Español (España)
- Español (México)
- Français
- Italiano
- Nederlands
- Português (Portugal)
- Polski
- Português (Brasil)
- Русский
- Türkçe
- العربية
- Ελληνικά
- Svenska
- Suomi
- עברית
- 日本語
- 한국어
- 简体中文
- 繁體中文
- Bahasa Indonesia
- Bahasa Melayu
- ไทย
- Tiếng Việt
- हिंदी
High-Risk Rounding Bottom In RIMM
Published 08/13/2012, 12:59 AM
Updated 07/09/2023, 06:31 AM
High-Risk Rounding Bottom In RIMM
Latest comments
Loading next article…
Install Our App
Risk Disclosure: Trading in financial instruments and/or cryptocurrencies involves high risks including the risk of losing some, or all, of your investment amount, and may not be suitable for all investors. Prices of cryptocurrencies are extremely volatile and may be affected by external factors such as financial, regulatory or political events. Trading on margin increases the financial risks.
Before deciding to trade in financial instrument or cryptocurrencies you should be fully informed of the risks and costs associated with trading the financial markets, carefully consider your investment objectives, level of experience, and risk appetite, and seek professional advice where needed.
Fusion Media would like to remind you that the data contained in this website is not necessarily real-time nor accurate. The data and prices on the website are not necessarily provided by any market or exchange, but may be provided by market makers, and so prices may not be accurate and may differ from the actual price at any given market, meaning prices are indicative and not appropriate for trading purposes. Fusion Media and any provider of the data contained in this website will not accept liability for any loss or damage as a result of your trading, or your reliance on the information contained within this website.
It is prohibited to use, store, reproduce, display, modify, transmit or distribute the data contained in this website without the explicit prior written permission of Fusion Media and/or the data provider. All intellectual property rights are reserved by the providers and/or the exchange providing the data contained in this website.
Fusion Media may be compensated by the advertisers that appear on the website, based on your interaction with the advertisements or advertisers.
© 2007-2024 - Fusion Media Limited. All Rights Reserved.
