
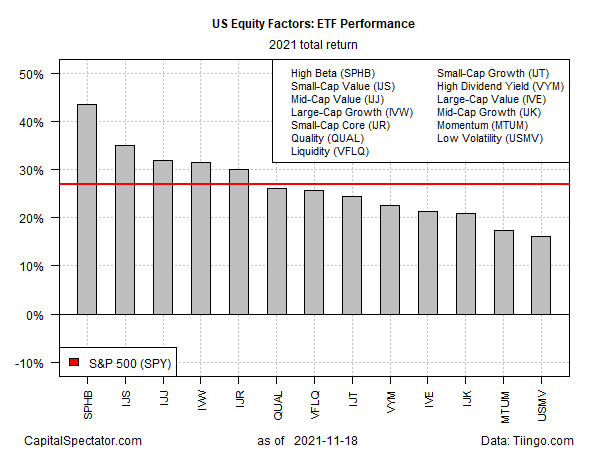
With just over a month to go until we put a fork in 2021, high-beta stocks look set to deliver the strongest performance among U.S. equity factors this year, based on a set of ETFs.
Invesco S&P 500® High Beta ETF (NYSE:SPHB) is up more than 43% year to date through yesterday’s close (Nov. 18). That’s well ahead of the second-best performer – small cap value (iShares S&P Small-Cap 600 Value ETF (NYSE:IJS)), which is ahead by nearly 35% so far in 2021.

The broad stock market – SPDR® S&P 500 (NYSE:SPY) – is having a good year, too, although it’s far behind SPHB’s red-hot run. As of Thursday’s close, SPY gained nearly 27% year to date.
There’s a wide variety of performances this year, but it speaks volumes that all of our ETF proxies for U.S. equity factors are higher this year. Even the weakest performer – low volatility (iShares MSCI USA Min Vol Factor ETF (NYSE:USMV)) – is up a solid 16.2%.
It’s not every year that you can randomly throw money at just about any slice of the equity factor universe and earn a relatively high return. A lot can happen between now and the end of the year, of course. But at the moment, beta risk writ large for U.S. shares is on track to deliver strong, and in some cases, stellar results.
If there’s a leadership change between now and celebrations for the new year, large-cap growth is on the short list at the moment for a potential reshuffling of the deck. For the last several months the iShares S&P 500 Growth ETF (NYSE:IVW) has been gaining ground on a relative basis. Using the last three months as a guide shows that IVW has overtaken small-cap value (iShares S&P Small-Cap 600 Value ETF (NYSE:IJS) as the second-best performer behind high beta (Invesco S&P 500® High Beta ETF (NYSE:SPHB)).

What’s driving the growth portfolio? Some of it (perhaps most of it) is related to construction details of IVW, which is a relatively concentrated portfolio that’s loaded up with Big Tech – Microsoft (NASDAQ:MSFT), Apple (NASDAQ:AAPL) and Amazon (NASDAQ:AMZN) are the top-three holdings, representing about 29% of the portfolio (as of Nov. 18).
SPHB, by contrast, is a far-less concentrated play on its high-beta target stocks. Indeed, the top-5 holdings (starting with Tesla (NASDAQ:TSLA)) represent a bit more than 8% of the portfolio (Nov. 17).
Factor investing via ETFs, in other words, isn’t always a pure play on risk premiums. There’s the complicating issue of different portfolio-construction methodologies to consider too. That’s a reminder that how an ETF is managed can sometimes be just as important, if not more so, than the risk factor (or factors) selected.