
Ollie's Bargain Outlet Holdings, Inc. (NASDAQ:OLLI) is slated to report second-quarter fiscal 2019 results on Aug 28. In the last reported quarter, this value retailer delivered a positive earnings surprise of 4.6%. The company’s bottom line has also outperformed the Zacks Consensus Estimate by average of 4.3% in the trailing four quarters. Let’s delve deeper and analyze the factors that are likely to influence the upcoming quarterly results.
How Are Estimates Shaping Up?
After registering a bottom-line increase of roughly 12.2% in the first quarter of fiscal 2019, Ollie's Bargain is likely to witness year-over-year growth of about 15% in the second quarter. The Zacks Consensus Estimate for the quarter under review is pegged at 46 cents compared with 40 cents reported in the year-ago quarter. We note that the Zacks Consensus Estimate has remained unchanged in the last 30 days. The Zacks Consensus Estimate for revenues is pegged at $339.8 million, indicating an improvement of approximately 18% from the year-ago quarter.
Factors Likely to Influence Q1
Ollie's Bargain’s business model of “buying cheap and selling cheap”, cost-containment efforts, focus on store productivity, decent comparable-store sales performance and expansion of customer reward program, Ollie's Army, fortify its position. Cumulatively, these have positioned the company to augment both top and bottom-line performance in the to-be-reported quarter.
The company’s results are highly dependent on the availability of brand name and closeout merchandise at compelling prices, as the same represents roughly 70% of goods purchased. Moreover, the company sells merchandise at prices up to 70% lower than the department and fancy stores, and up to 20-50% lower than mass-market retailers.
Analysts pointed that stiff competition, rise in supply chain costs and any deleverage in SG&A expenses remain concerns. The company had stated earlier that gross margin is likely to contract 20-30 basis points during the second quarter. Further, SG&A expenses have been increasing for quite some time now. In the first quarter of fiscal 2019, it improved 15.2% on account of higher selling expenses driven by new store growth and increased sales volume.
Ollie's Bargain Outlet Holdings, Inc. Price, Consensus and EPS Surprise
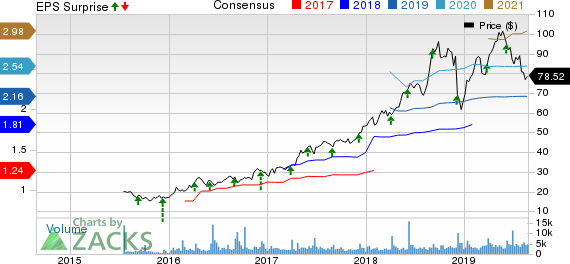
Ollie's Bargain Outlet Holdings, Inc. price-consensus-eps-surprise-chart | Ollie's Bargain Outlet Holdings, Inc. Quote
What the Model Predicts?
Our proven model does not conclusively show that Ollie's Bargain is likely to beat estimates this quarter. A stock needs to have both — a Zacks Rank #1 (Strong Buy), 2 (Buy) or 3 (Hold) and a positive Earnings ESP — for this to happen. You can uncover the best stocks to buy or sell before they’re reported with our Earnings ESP Filter.
Ollie's Bargain has a Zacks Rank #2 but an Earnings ESP of -0.62%, which makes surprise prediction difficult.
Stocks With Favorable Combination
Here are some companies you may want to consider as our model shows that these have the right combination of elements to post an earnings beat:
Casey’s General Stores (NASDAQ:CASY) has an Earnings ESP of +8.43% and a Zacks Rank #1. You can see the complete list of today’s Zacks #1 Rank stocks here.
Burlington Stores (NYSE:BURL) has an Earnings ESP of +0.17% and a Zacks Rank #2.
Costco (NASDAQ:COST) has an Earnings ESP of +0.30% and a Zacks Rank #3.
Today's Best Stocks from Zacks
Would you like to see the updated picks from our best market-beating strategies? From 2017 through 2018, while the S&P 500 gained +15.8%, five of our screens returned +38.0%, +61.3%, +61.6%, +68.1%, and +98.3%.
This outperformance has not just been a recent phenomenon. From 2000 – 2018, while the S&P averaged +4.8% per year, our top strategies averaged up to +56.2% per year.
See their latest picks free >>
Ollie's Bargain Outlet Holdings, Inc. (OLLI): Free Stock Analysis Report
Caseys General Stores, Inc. (CASY): Free Stock Analysis Report
Costco Wholesale Corporation (COST): Free Stock Analysis Report
Burlington Stores, Inc. (BURL): Free Stock Analysis Report
Original post
Zacks Investment Research