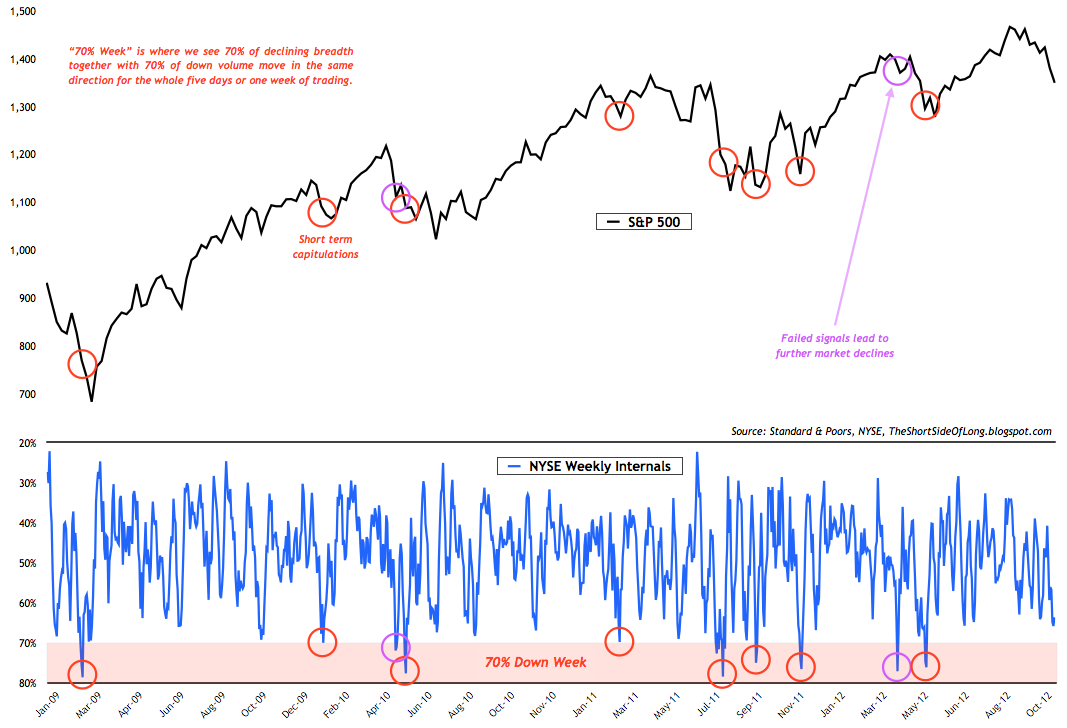
We are starting to see some signs of the equity market becoming oversold from a short term perspective.
The chart above shows that we are approaching internal breadth capitulation in the near term, especially thanks to Wednesday's strong selling pressure resulting in a 90% down day. The basic 10 day Advance Decline Line is also signalling oversold levels. The percentage of stocks within the S&P 500 above the 10 MA & 50 MA also hit a low reading, regularly associated with short term bounces (chart here & chart here).
According to Tom McCellan, a well respected technical analyst, his own Summation Index is now also oversold. Furthermore, more than one fifth of the S&P 500's components now show an oversold RSI reading of 30 or below, while the index itself has also become oversold too. Finally, the Bespoke website reported that 27 out of 30 Dow Jones components are now oversold. All in all, one could make an argument that a bounce or relief rally might be in store soon.
However, be warned that markets remained overbought for a prolonged period of time in an uptrend, so they can just as easily remain oversold for prolonged periods during a downtrend. Also be warned that oversold readings work better when the price is above 200 MA, like we saw in June. All major indices are now below the 200 MA. Having said all that, you won't see me buying equities.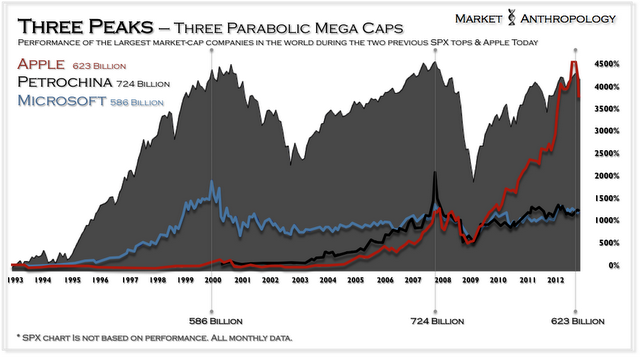
The current secular bear market in the Western World began in the year 2000 and has so far progressed in a sideways trading range for the last 12 years. I believe we are now approaching a peak in the current cyclical bull market, as investors should get ready for one last major bear market.
This week I came across an interesting chart, which showed how each one of the major S&P 500 peaks was marked by a market capitulation bubble in a company which became the daring of the investment world. In 2000 it was Microsoft (MSFT) leading the way, in 2007 it was Petrochina (PTR) leading the way, and today it is Apple (AAPL).
As you probably already know, CNBC has a special section on the morning Squawk Box called "iEconomy". This segment tracks... you guessed it... everything Apple related. After all, somewhere between stocks, bonds, currencies, commodities, real estate and alternatives, Apple has become its own asset class.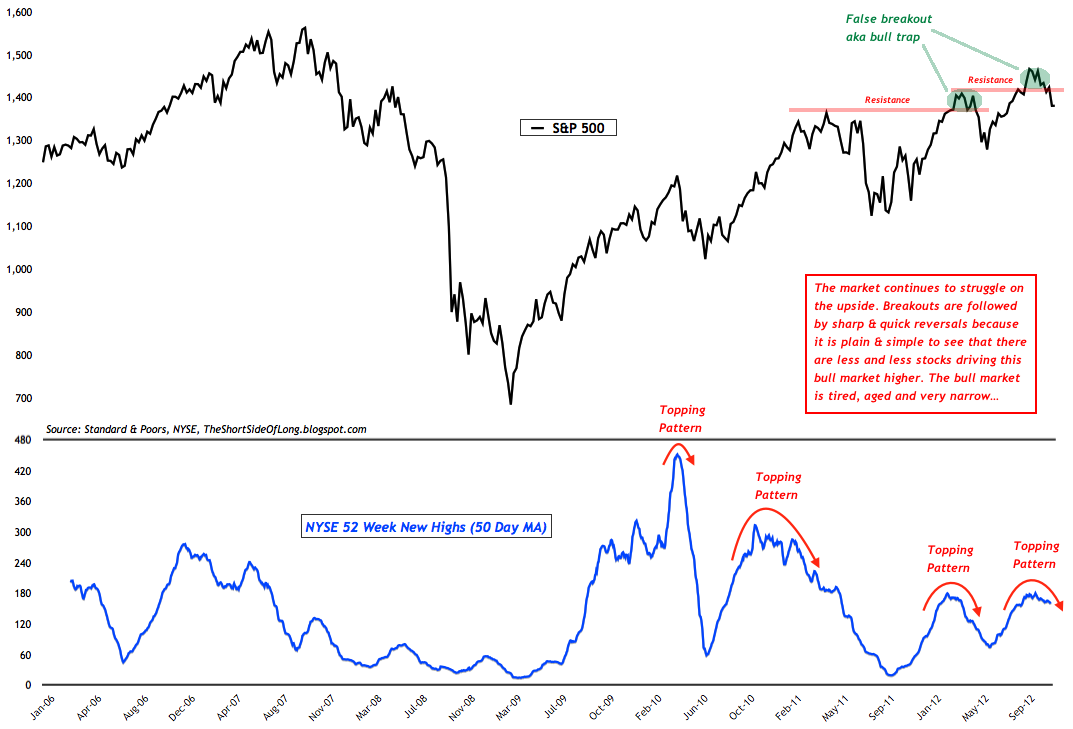
The bull market that started on the 06th of March 2009 is aged, tired and exhausted. It is either ending or close to its final top.
Bob Farrell, a legendary investor, used to say that:
"markets are strongest when they are broad and weakest when they narrow to a handful of blue-chip names."
The chart above shows the internal strength of the NY stock exchange components making 52 week new highs has been narrowing with every new rally to the upside. The most likely reason we have constant re-occurrences of false breakouts (aka bull traps) is because each time the index breaks out to a new bull market high, it is accomplished with fewer and fewer individual names participating.
As already discussed above, I assume that we might soon bounce from oversold conditions, but I hardly doubt there is a possibility of new highs. Having said that, anything is possible with the right amount of QE, according to Helicopter Ben!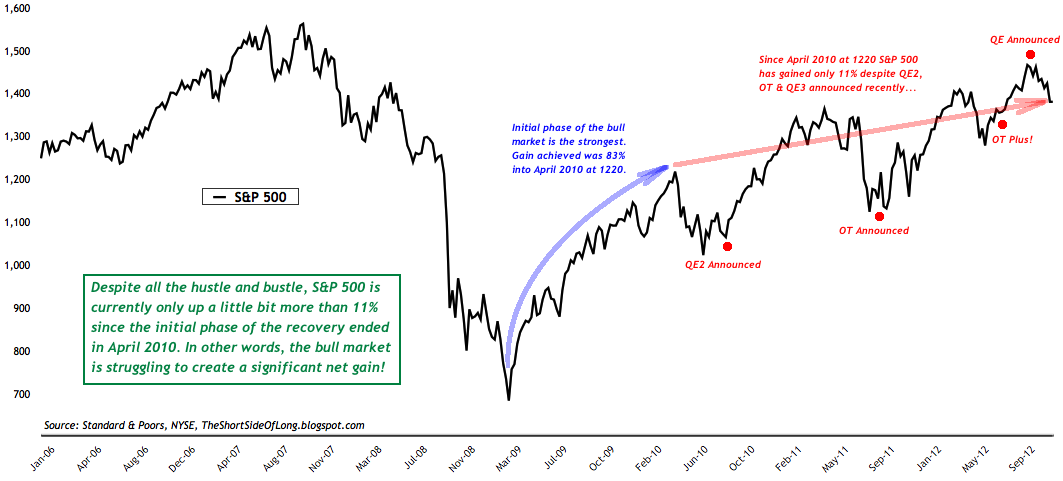
As we can see in the chart above, the majority of gains in the current cyclical bull market occurred at the beginning of the recovery, from March 2009 towards April 2010. One might ask, why is April 2010 an important measuring point?
Because in my opinion, that was the end of the natural economic rebound, post the 2008 rescission. Everything else was mainly driven by constant intervention by global central banks.
Another reason why I measure performance from that period is because that was the first major peak in the current bull market and what most investors call a mid cycle slowdown. Therefore, personally for me, it is important to measure the true net gain as the bull market progressed onwards. The verdict is out: despite all the hustle & bustle, all of the fiscal & monetary stimulus (over 5 trillion in the US), despite global central bank rate cuts, despite record high earnings, and despite constant positive news flow from various media outlets (you know the ones) - the S&P 500 has managed to gain only 11% from its April 2010 peak.
Comparing that to it's initial phase, where gains exceeded 80% in the space of 12 months, one has to ask themselves, is the equity market really worthy of your money this late in the business cycle?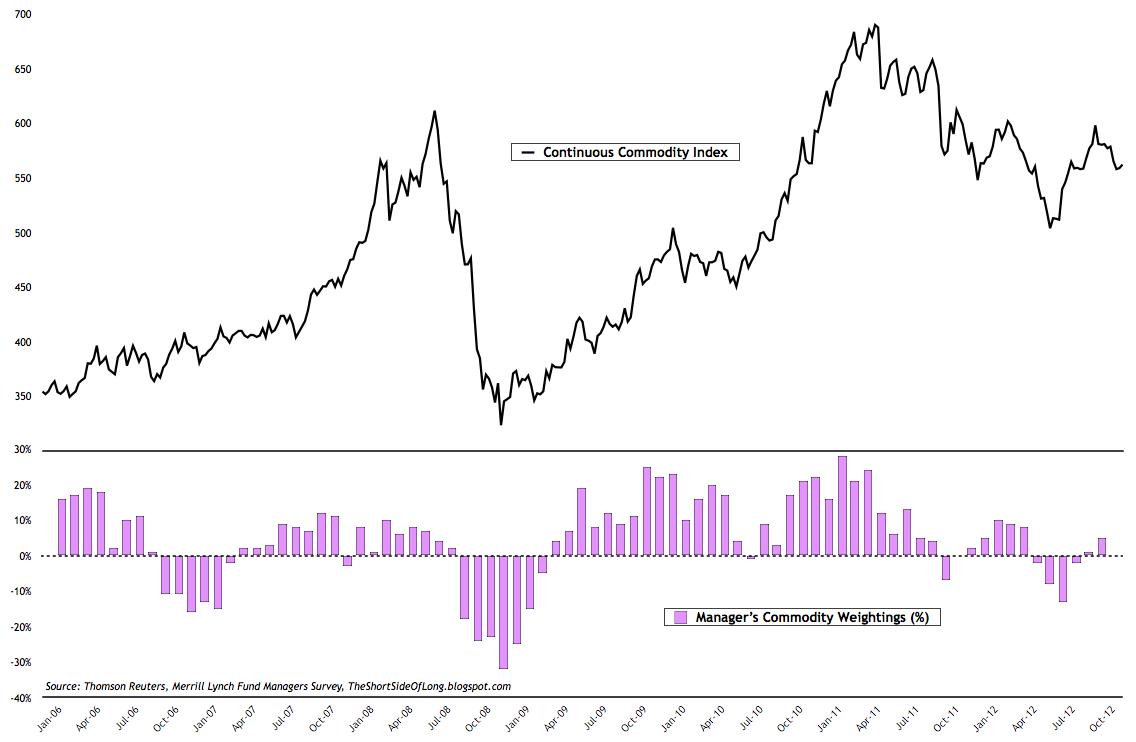
The recent monthly issue of the BofA Merrill Lynch Global Fund Manager Survey showed that investors continued to sell down Bond exposure while bidding up Equity exposure for the fifth month in a row. Despite falling prices and deteriorating fundamentals, global fund managers are now more bullish on equities than they were in March 2012, prior to an intermediate top.
Interestingly as the chart above shows, managers are not as optimistic on commodities with exposure remaining at neutral levels. Regionally, global fund managers are once again falling in love with Emerging Markets, while shying away from Japan. A case could be made that Japan is a steal at current prices. Also to note, the Consumer Discretionary sector stands at an all time record high overweight.
Finally, global hedge fund exposure is now around 40% net long on average. That reading is the highest during the current cyclical bull market - higher than in April 2010 prior to the Flash Crash, May 2011 prior to the Debt Ceiling sell off and March 2012 prior to the Greek election panic. The Merrill Lynch team writes: "Since 2007, whenever HF exposure has exceeded 35% SPX has underperformed Treasuries by 700bps in the following month."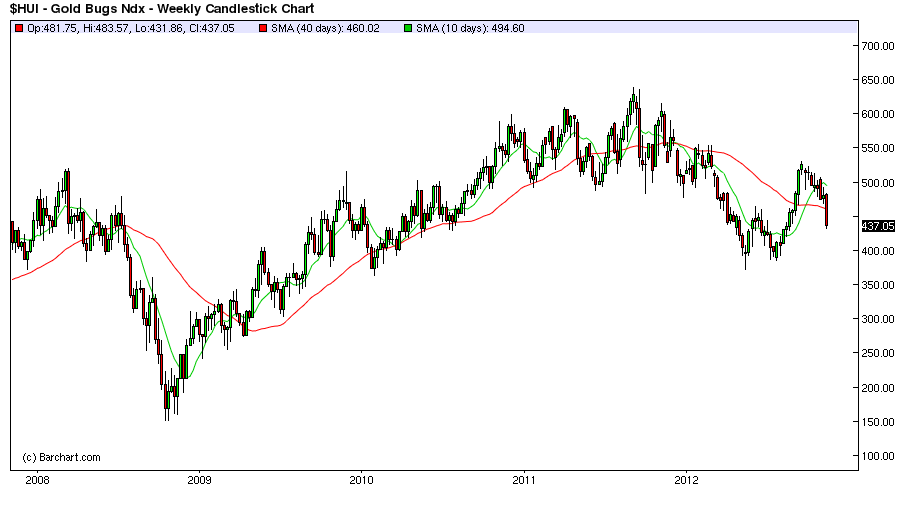
The talking point in the Precious Metals sector this week is the huge decline experienced by the Gold Bugs Index (HUI) or the Gold Mining ETF (GDX). It seems that the declines took quite a few traders by surprise, especially as prices declined rapidly over the last two days.
Personally, I had no interest in buying PMs in recent times, as quite a lot of PMs blogs, forums and newsletter writers expect "imminent upside break outs to test record highs". Many that claimed miners were a great entry two weeks ago still claim that miners are a great entry today, however a lot has changed in the last few weeks.
First of all, the short term breadth has turned oversold, as the percentage of stocks above the 10 MA & 50 MA has now flatlined to 0%. The rise in volume over the last two days during panic selling can also be linked to a short term capitulation, as many retail trader's stops got triggered with prices falling below the 200 MA (chart above). There is now a possibility of a short term bounce, but personally, I am not playing this sector nor am I investing more capital into PMs just yet. I like to buy when real liquidation is evident and there are still way too many traders holding their position (with large drawdowns in hand), claiming that prices will recover in coming months. If their stops get triggered and they panic, it will be the time to buy!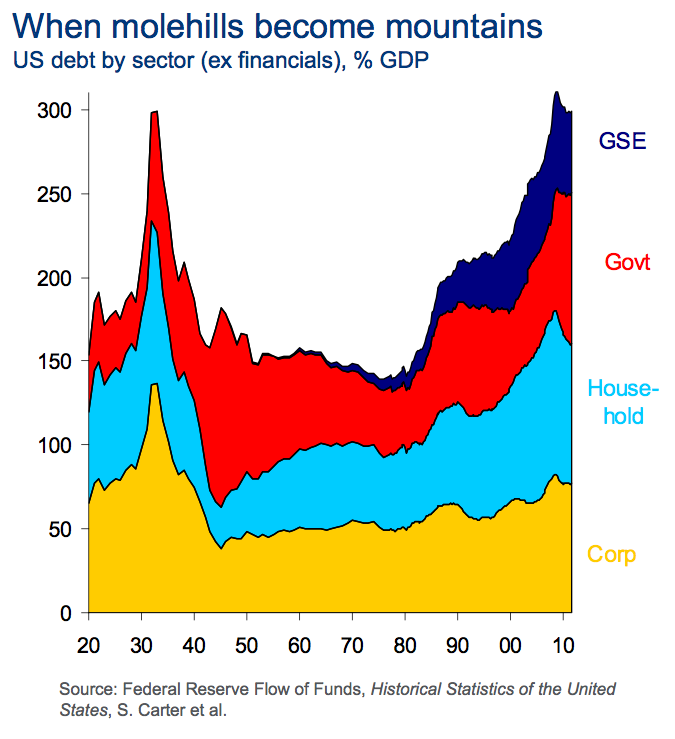
As the majority of you already know, we are in a very rare period in financial history. Once or twice a century the world economy tends to reach its limit on the amount of leverage it can take up. At that point in time, be it 1929 or 2007, various sectors of the economy start to de-leverage.
According to the Citigroup chart above, the de-leveraging period is still in its early days compared to the last cycle we saw in 1930s. Households are leading the way, which is a very good sign, but there is still a lot more pain to go through. According to Gary Shilling, one of the smartest investors out there, the de-leverging could go on for another 5 to 7 years. I assume that the up-and-coming recession and a bear market will really speed up that process. Buckle up!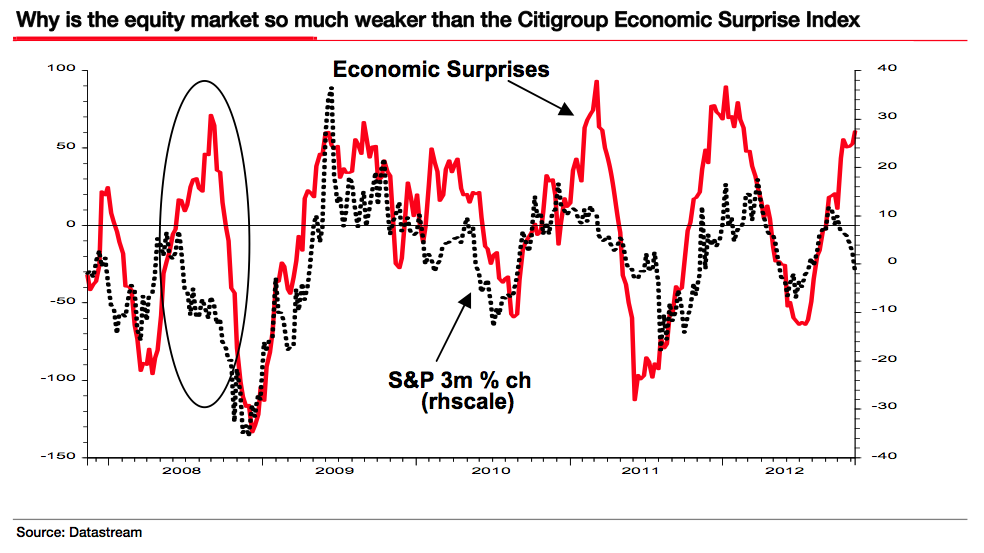
In his recent newsletter written on the 14th of November, Albert Edwards goes on to say that the equity market is not falling due to the fiscal cliff, but because future prospects of economic activity and earnings will most likely disappoint - something I have been warning about for months already. Mr Edwards says that:
"the bottom line is: despite the upside economic surprises, profits have been spiralling downwards. It’s not the impending fiscal cliff the market is worrying about, it’s the actual profits cliff we have already fallen off."
You will notice that in early 2008, Citigroup Economic Surprise Index was rising but the equity market was falling (circled). We have a similar picture today, were data continues to improve against economists expectations, but the equity markets aren't buying it. A lot of bulls have been tricked recently with this indicator.
As Mr Edwards's prior boss, Roger Palmer used to say: "if the market can’t go up on ‘good’ news it will fall very sharply on ‘bad’ news.” Another great quote I also tend to use from time to time is from the wisdom of Marc Faber, who frequently says that: "when the price of an asset fails to make a new low on unfavourable news, it could be starting to price in more favourable conditions. The inverse is also true for an asset that fails to make a new high, under very favourable conditions." So you might be wondering when will the bad news start to appear in the press?
Featured Article
*** Updated Version ***
Since the current post did not feature a major topic due to the lack of economic events, the recent update of the Important Charts page is a perfect way to summarise the current market conditions from equities to bonds and from currencies to commodities. The other option was to discuss politics about Israel and Palestine, but I prefer for this blog to remain in economic nature. Therefore, let us begin.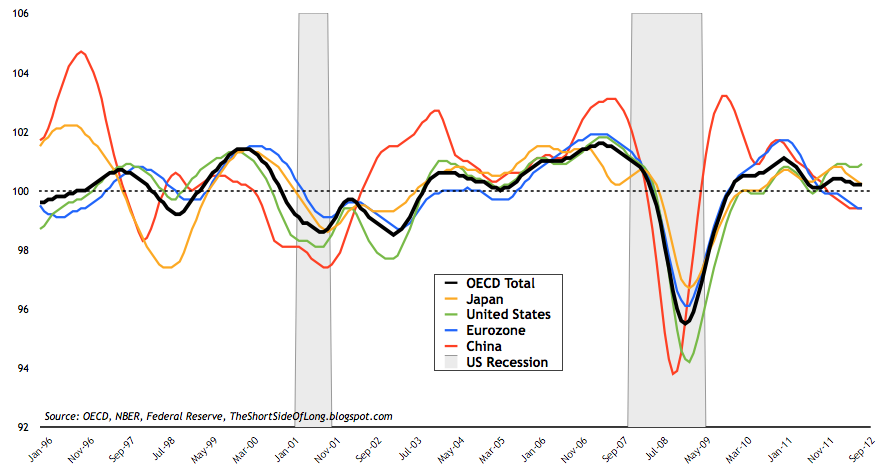
OECD Leading Economic Indicators, which came out on 12th of November, showed that the global economic activity remains split since the mid cycle slowdown in 2011. Eurozone has entered an official recession and continues to weaken further. Chinese growth is below trend and still slowing from a year ago. I do not believe the recent official data, which was published during the leadership change, that signals a recovery is underway in China. Furthermore, Japan is now edging towards a recession, just like Eurozone. With three out of the main four economic regions either slowing or in a recession already, it is difficult to make a case that the US will continue to de-couple. With that in mind, I believe that the recent weakness in the equity market has almost nothing to do with the Fiscal Cliff, but almost everything to do with slowing growth in quarters ahead.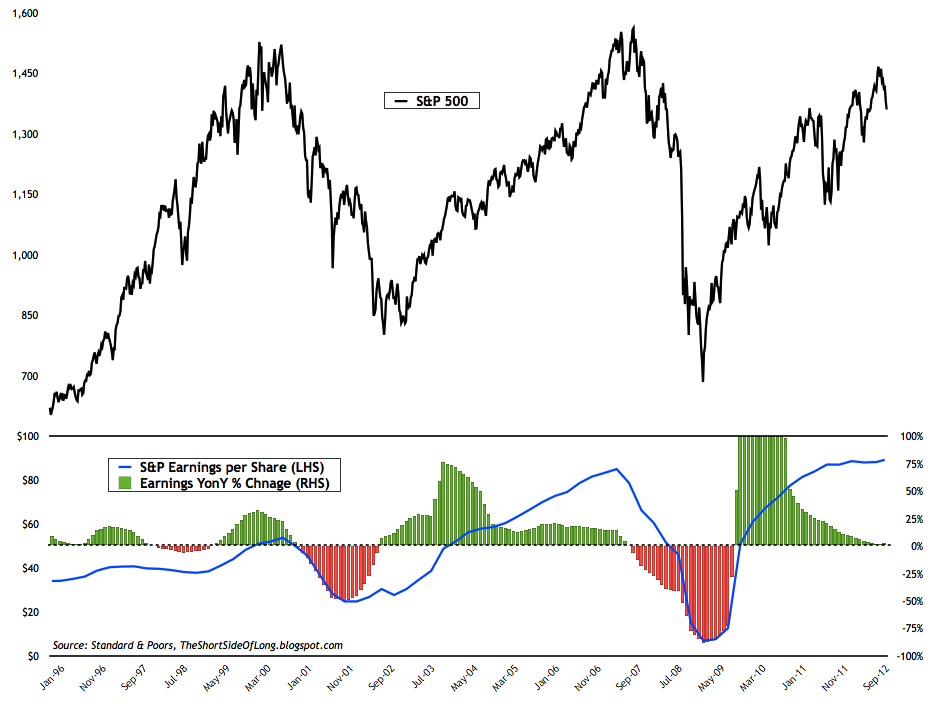
In my opinion, there is an above average chance that earnings will disappoint in coming quarters. In a recent summary, Jim Bianco pointed out that the current earnings beat rate has been the worst in over three years. Mind you, that is quite amazing relative to how the Wall Street plays the game, where analysts put expectations so low, even the shortest kid in the school somehow manages to complete a high jump. Out of the 500 S&P companies, 460 reported earnings to be down 2.2% and revenues (more important indicator) to be down 3.6%. Technology was the worst performer, with earnings down 4.3%. 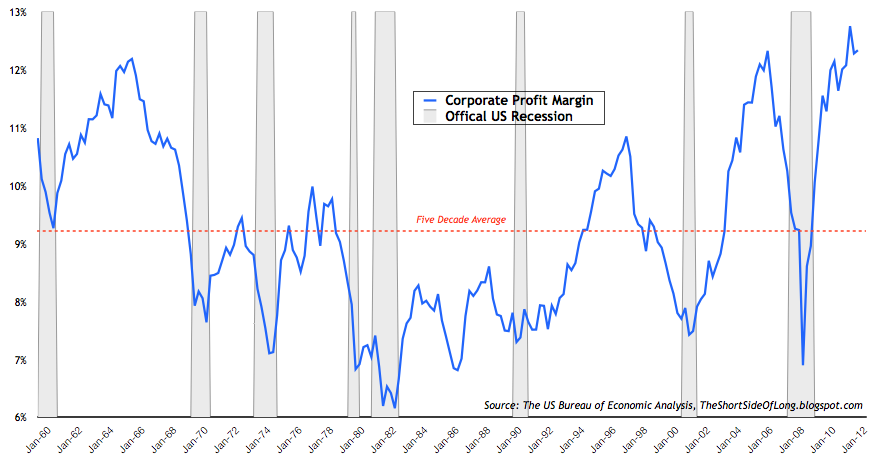
The most important point however, is that analysts expect earnings to rise by 11% and revenues to rise 3.6% in 2013. In my opinion, profit margins have already started to fall and we are most likely going to experience a classic mean reversion, which in turn will put pressure on company earnings. So... looking at the Wall Street analyst optimism from a contrary perspective, I am predicting a 2013/14 recession and a mean reversion in margins, disappointment in revenues and therefore a drop in earnings. 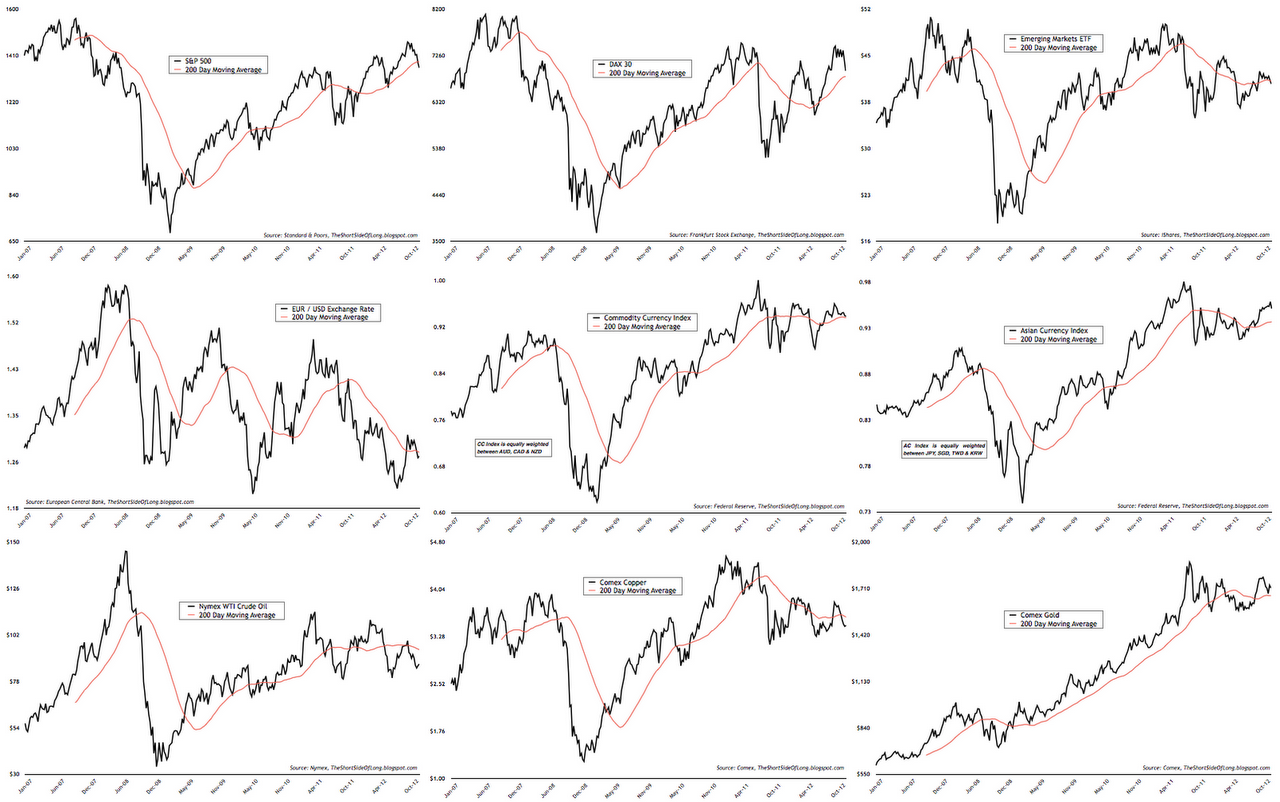
I think the risk on a.k.a. inflation trade is starting to sense this slowdown. Remember, markets look out into the future quarters and aren't worried too much about the present or the past. S&P 500 and Emerging Markets broke below their respective 200 MAs joining Crude Oil, Copper and Euro. Commodity currencies look like they want to follow lower as well. DAX 30 staged a 180 degree reversal of gains from the Draghi / Bernanke comments to do "unlimited bond purchases". Gold, together with Asian currency complex, remains above the 200 MA and shows at least some relative strength.
Overall, only the S&P 500 managed to exceed its 2011 highs, while all other risk assets continued in their sideways consolidations. Industrial commodities like Crude Oil and Copper are not buying into the "China recovery" story. If the recovery was real, I am sure these commodities would be a in a full force rally!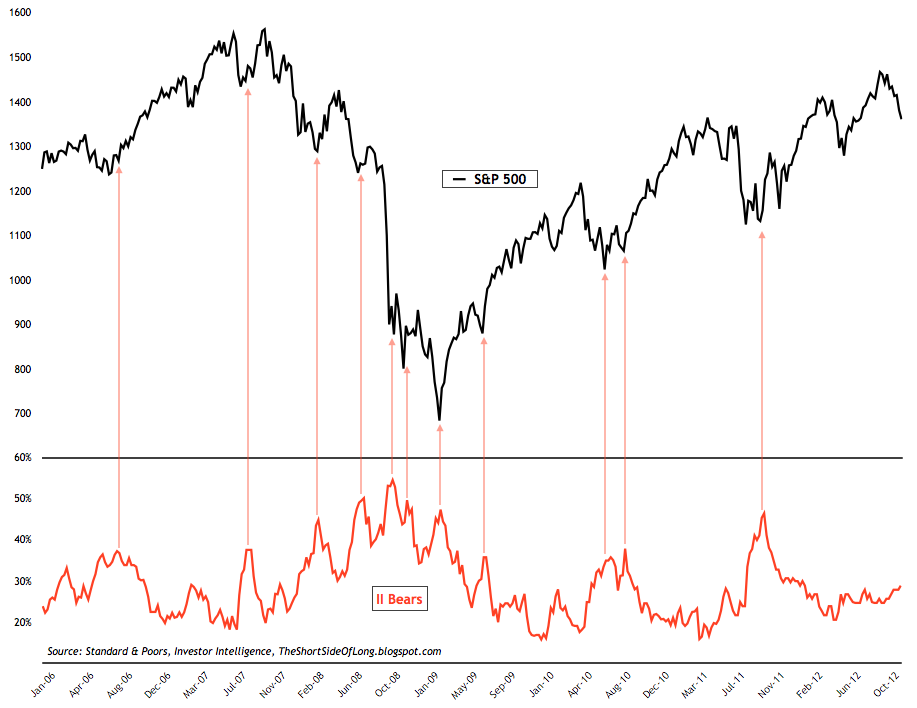
Despite a decently strong sell off, Investor Intelligence proportion of bearish advisors has not risen meaningfully. From intra day high of 1474 towards intra day low of 1343, S&P 500 has lost almost 10% and yet it is difficult to find a true bear out there. Various market participants continue to talk about bottoms and buying opportunities, neglecting deterioration in growth and earnings discussed above.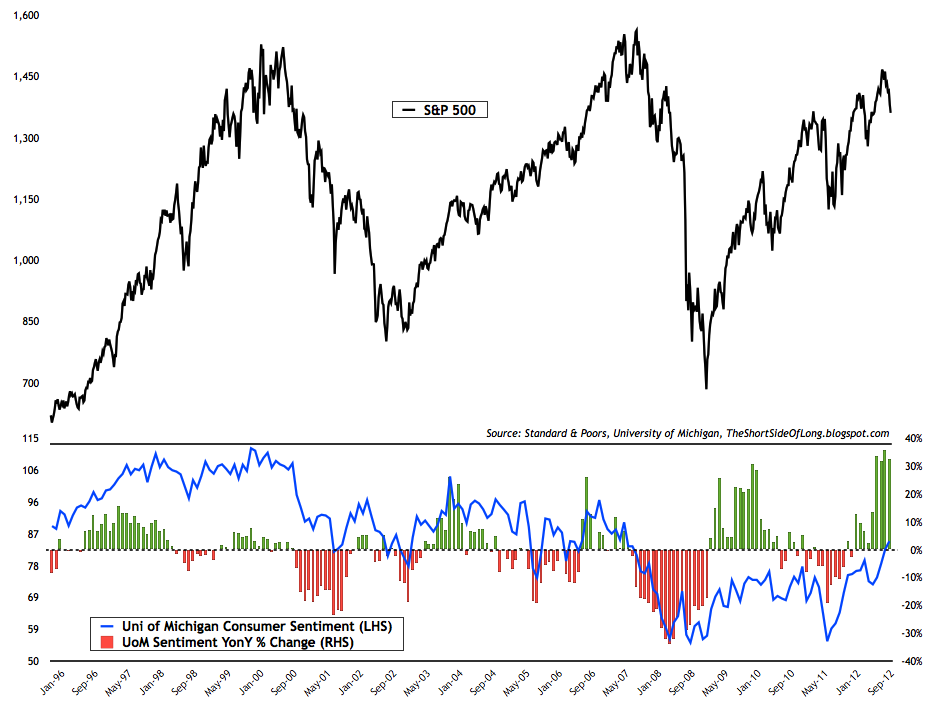
As the old saying on this blog goes... when it is obvious to the public, it is obviously wrong. The public is no where near the stage where one would consider them demonised or pessimistic. Judging by the recent trend in Uni of Michigan sentiment, the US consumer is remarkably upbeat relative to the low level of confidence we saw only a year ago. With politicians spending large of amounts of money to buy votes and to get re-elected, this shouldn't be a surprise. The chart above shows that we are most likely closer to a major market peak, rather than a major market trough.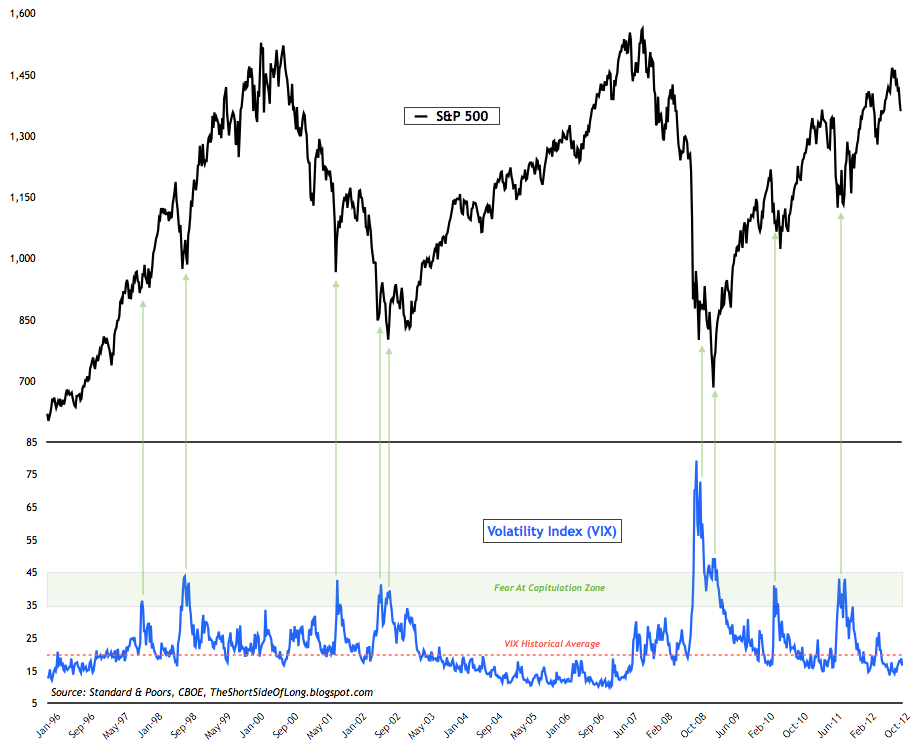
Usually, a good sign of a strong bottom is when real fear occurs, forcing weak hands to capitulate in a panic selling frenzy. Usually volume rises and VIX tends to spikes above 35 (unlike right now).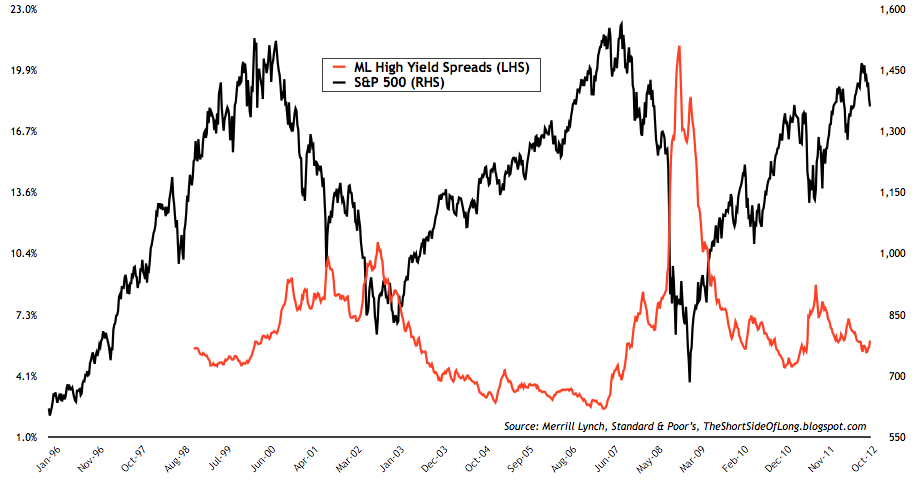
Confirmation of this fear also come from the credit market, as credit spreads widen during a downtrend. However, high yield credit spreads remain very low...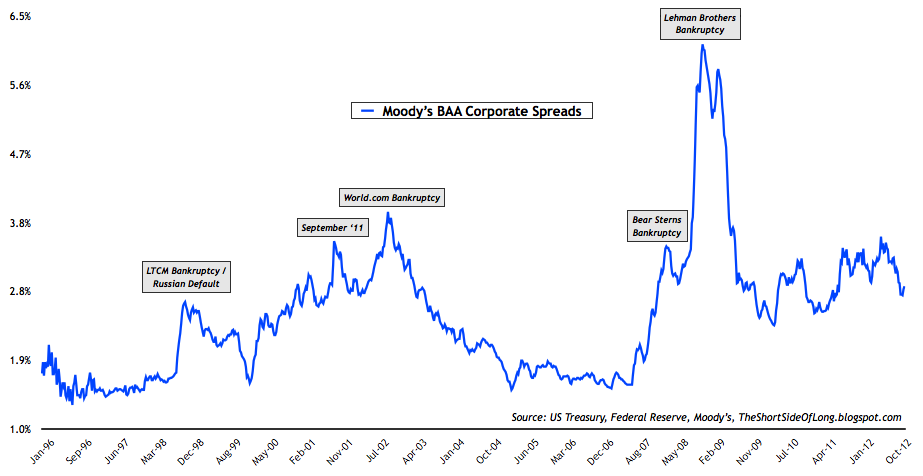
.. while corporate yield credit spreads resemble similar conditions.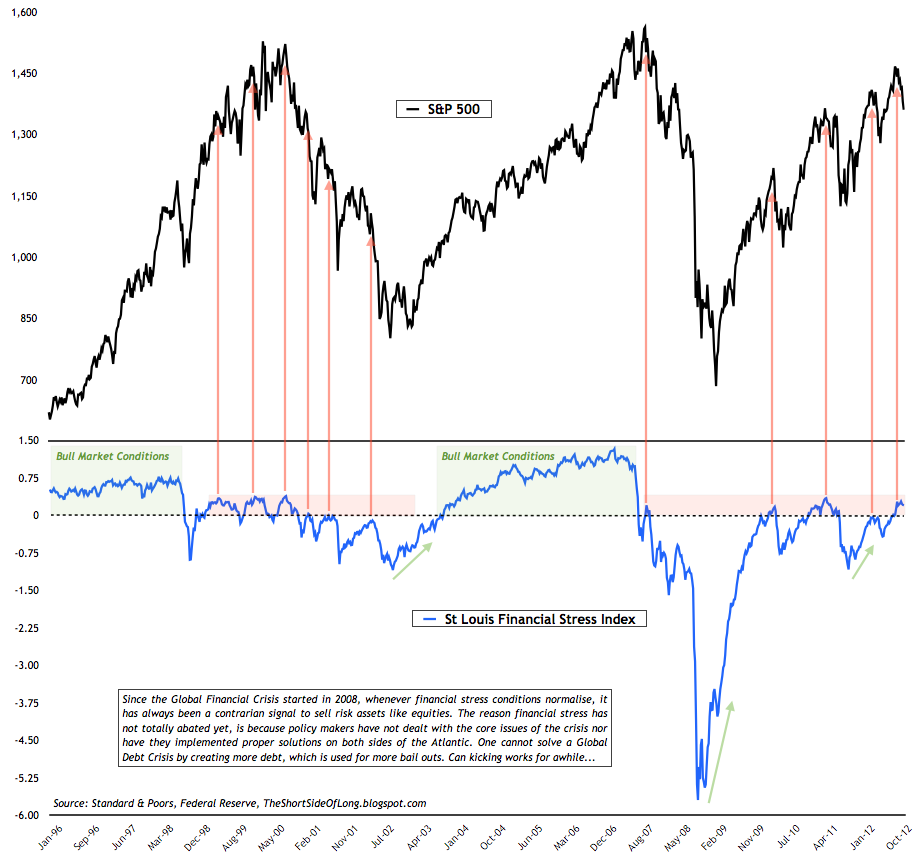
Financial stress usually tends to rise during a capitulation stage of a sell off. Currently, we can only see complacency judging from the chart above, which to me at least signals that this is more likely a major top rather than a bottom.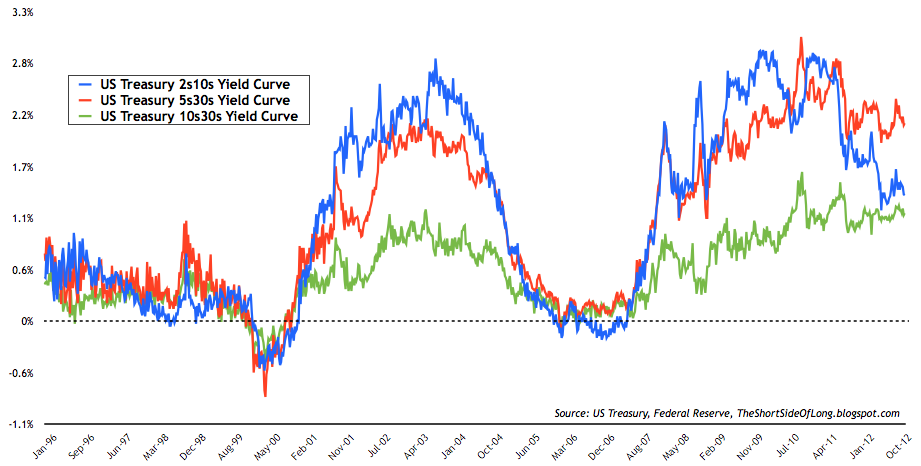
Finally, quite a worrying sign is that the Treasury Yield Curves are still flattening as investors lose confidence in Fed's ability to restart growth.
Now, let us remember that assets do not move in a straight line up or down. When prices become overbought or oversold, they tend to mean revert majority of the time. There are some basic reasons equity markets could also stage a relief rally of some kind, as we have gone down 10% in a hurry. The first market note at the beginning of this post outlines the current oversold readings from the short term perspective, so do take those into consideration.
Finally, I will cover hedge fund positioning in the various commodities and currencies, as reported by the CFTC commitment of traders on Friday.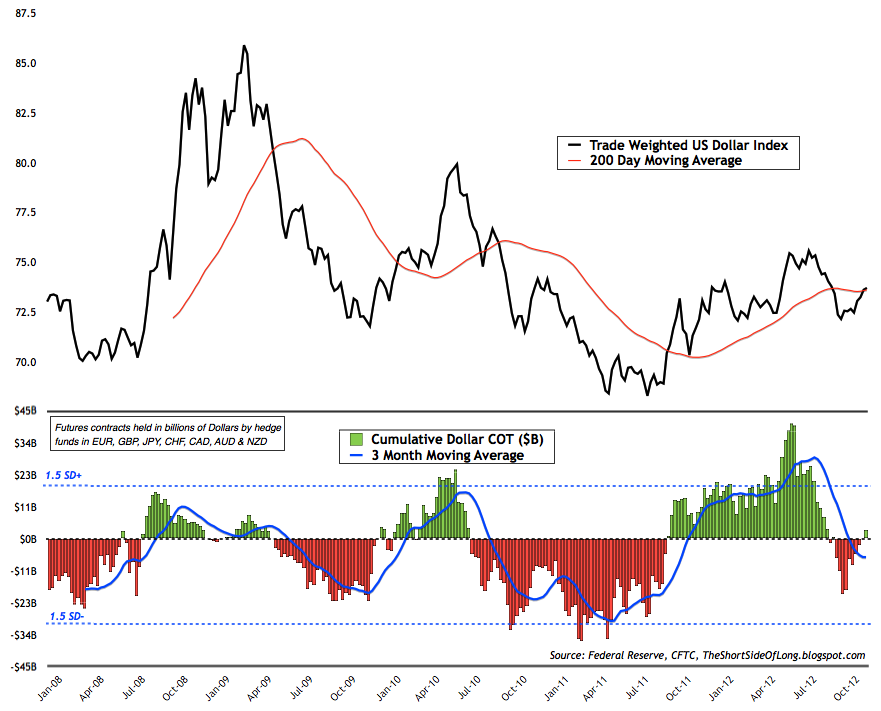
US Dollar positioning is now rather neutral, but interestingly enough, hedge funds have once again turned bullish on the greenback this week. At the same time, we can see that the short bets are still evident in the Euro and the Franc.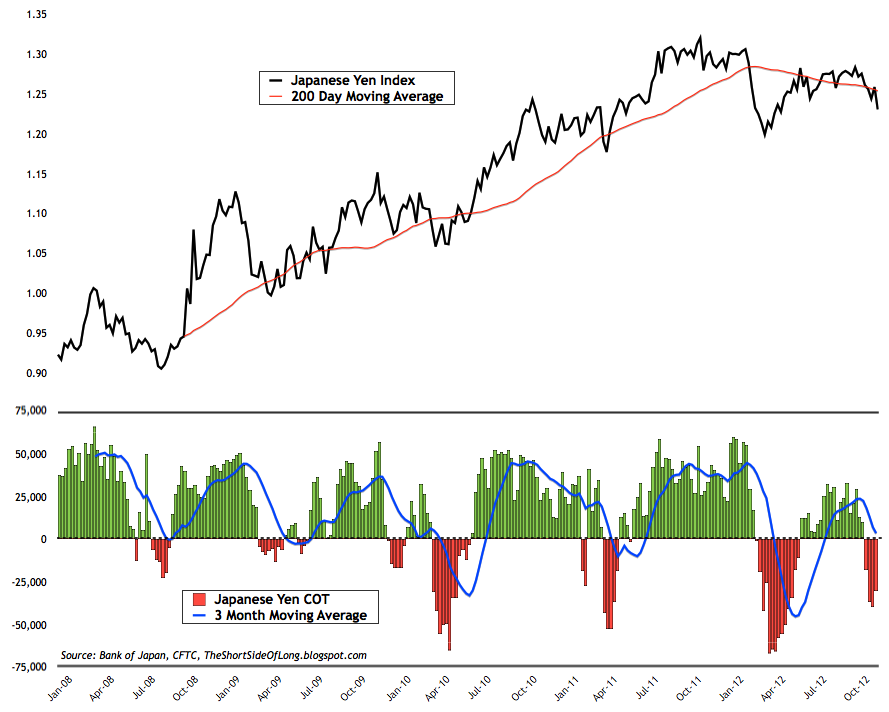
They are also evident in the Japanese Yen too. I personally think the Yen has further to run, despite Japan being heavily indebted. The fact of the matter is that Japanese households will continue to repatriate their investments from abroad, which should most likely push upside pressure on Yen exchange rate.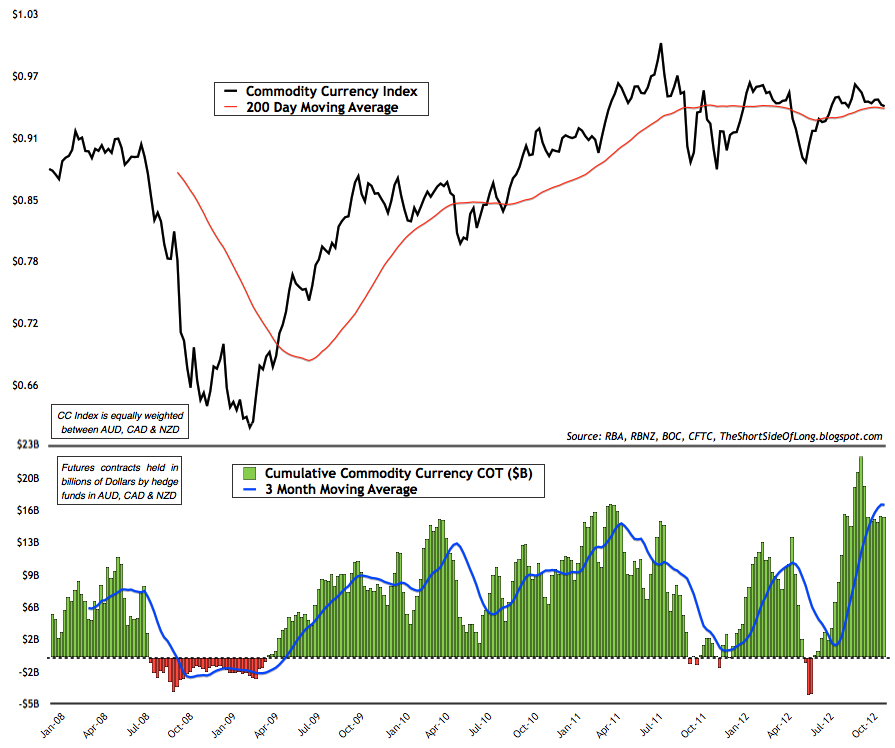
Interestingly, while hedge funds dislike G3 currencies like the Euro and the Yen in favour of the greenback, they are aren't negative on the commodity currencies. The chart above shows that bullish bets on the Aussie, Kiwi & Loonie are still quite extreme. At the same time, these currencies have failed to make a new high since middle of 2011. Is the market telling us something?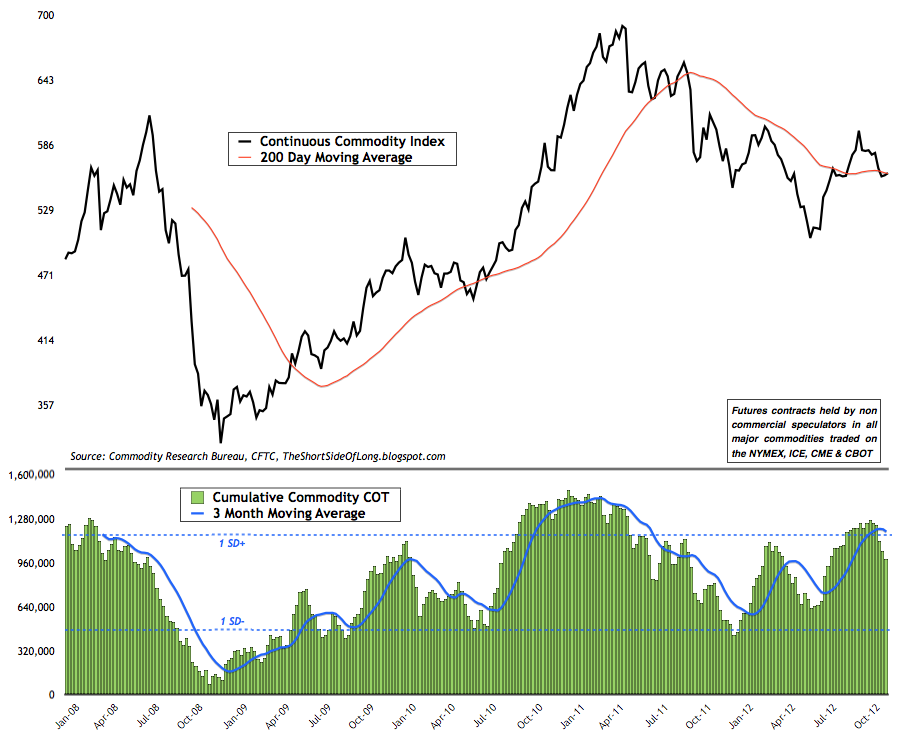
Hedge fund commodity positions are starting to be liquidated now. Over the last month or so, we have a seen a trend where speculators are rapidly cutting holdings in agriculture, energy and metals.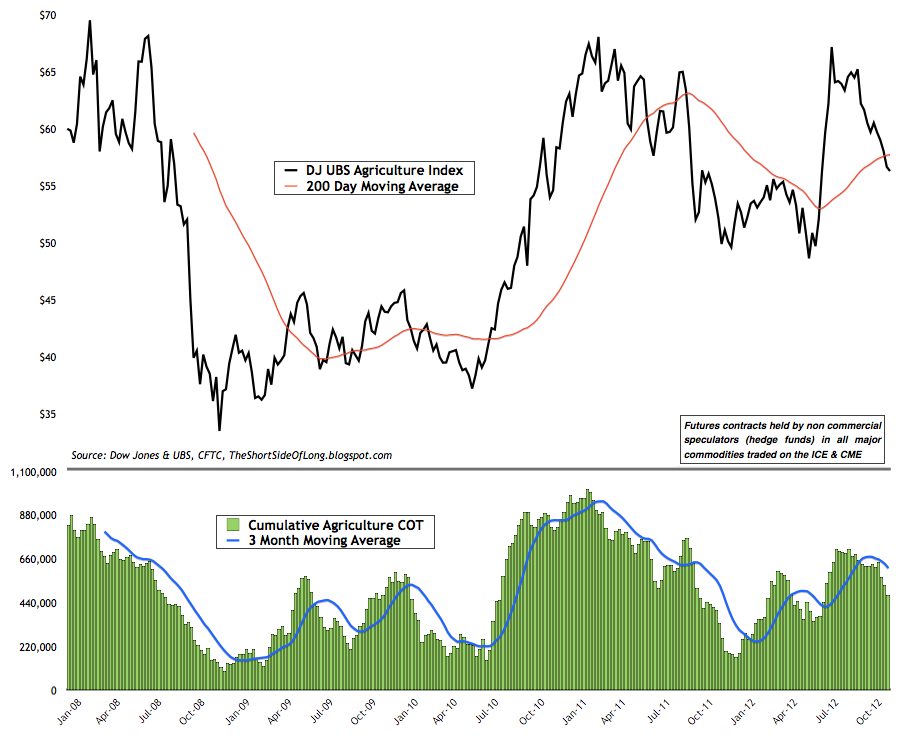
Judging by the strong correction in the Grains market and constant weakness in Softs, agricultural positioning is also being reduced rapidly too.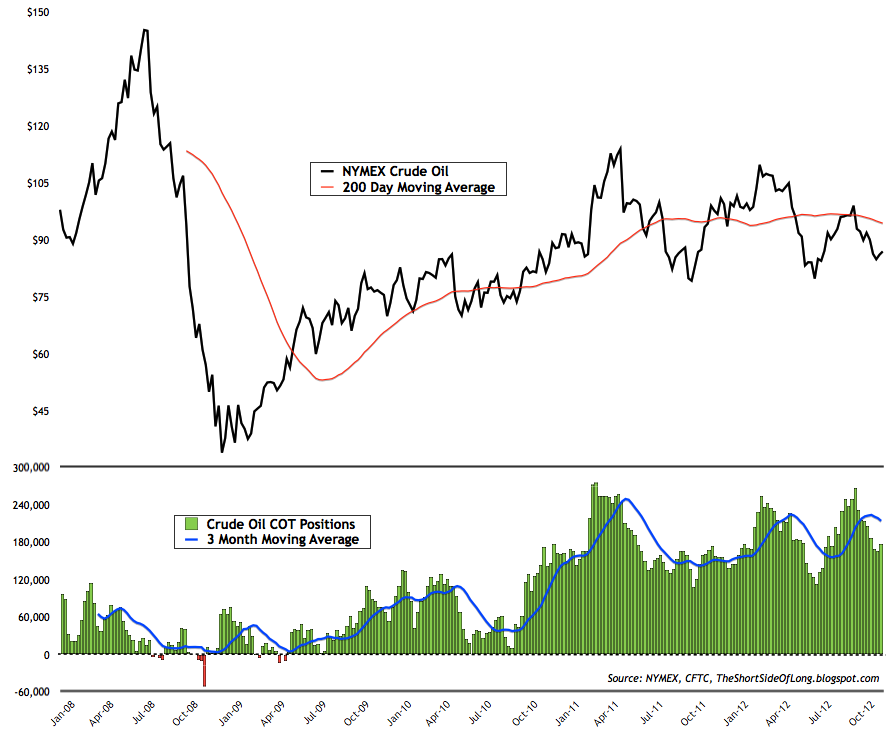
Crude Oil positioning has come back to earth...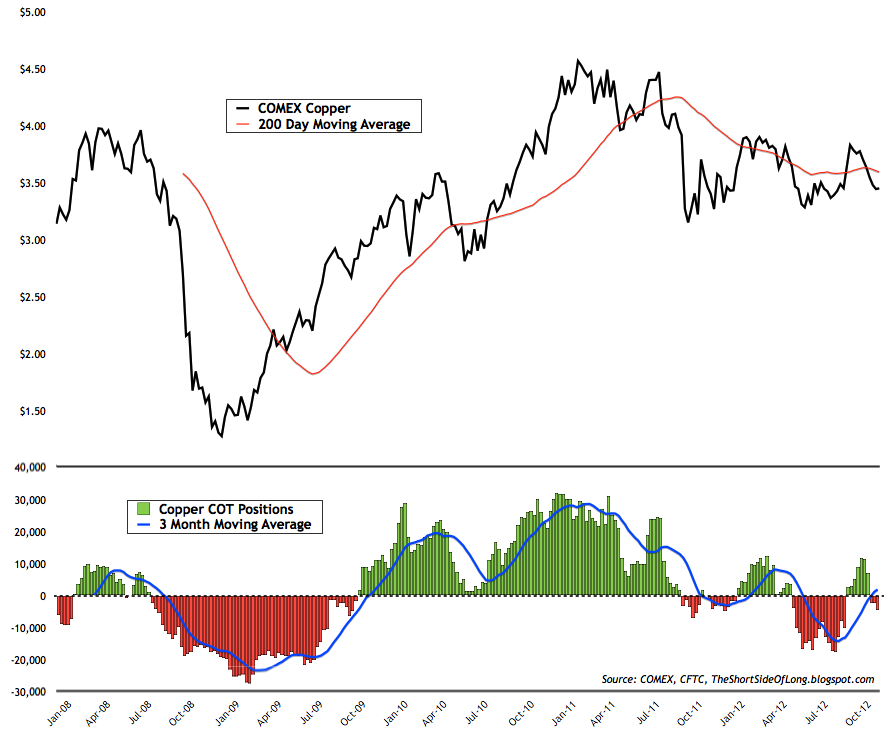
while traders have re-engaged their bearish Copper bets.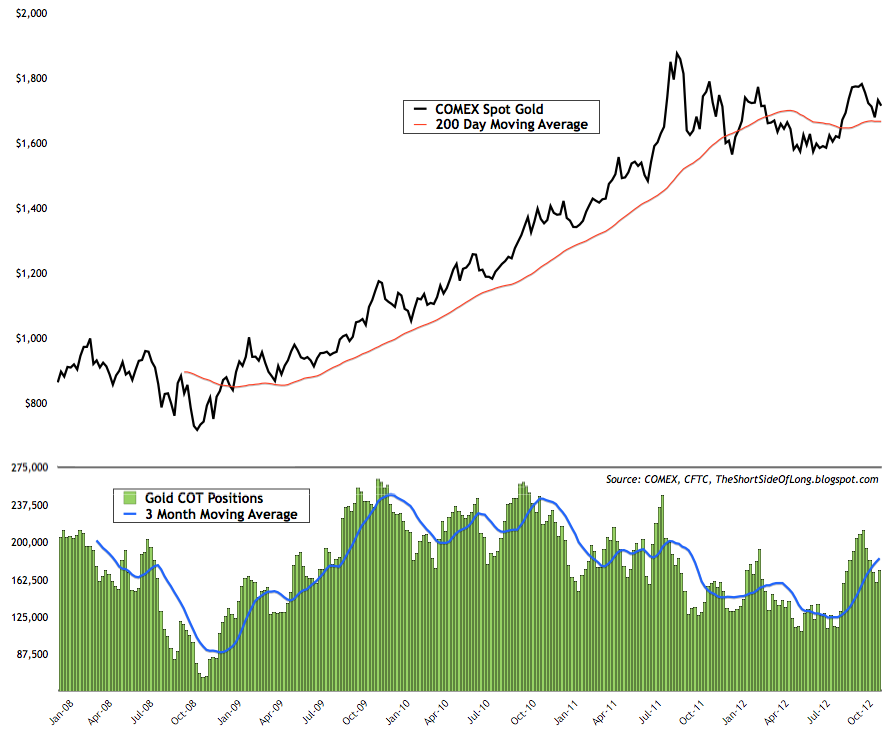
Within the Precious metals sector, hedge funds have reduced their Gold positioning since September peak...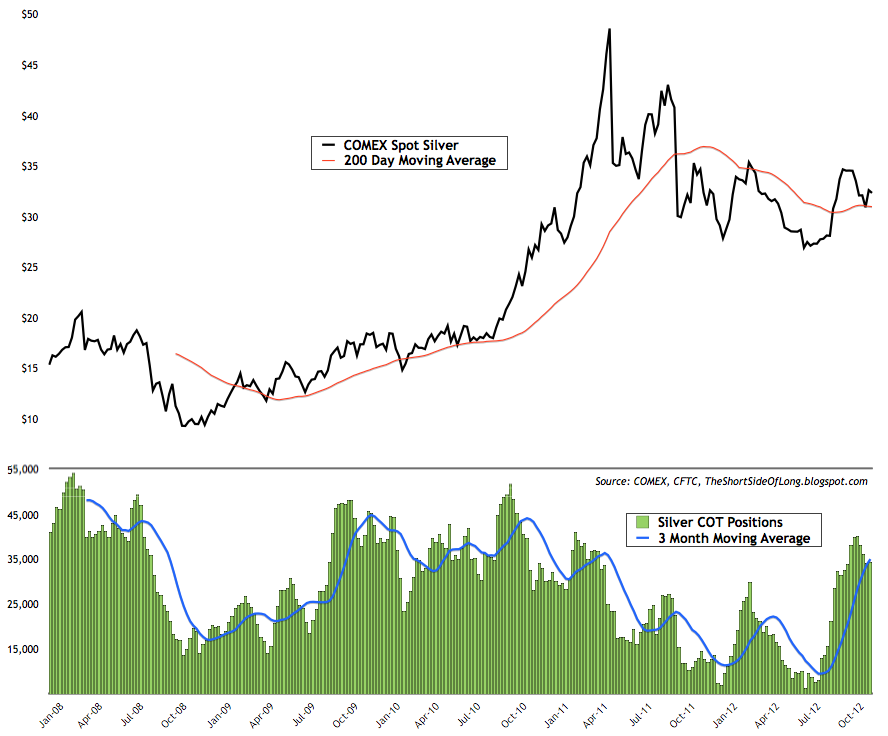
.. while we have also seen a small reduction in Silver positioning too.
Regular followers already know that two of my major Silver purchases were in late December 2011 and early July 2012. That is when hedge funds held the lowest net longs since at least 2001. The reason I am not buying Silver today is because there are still too many bulls for my likely. That does not mean I am selling my Silver either, but as there is just not enough bears to lure me into putting extra capital to work from the bullish side.
Do I see any opportunities anywhere? 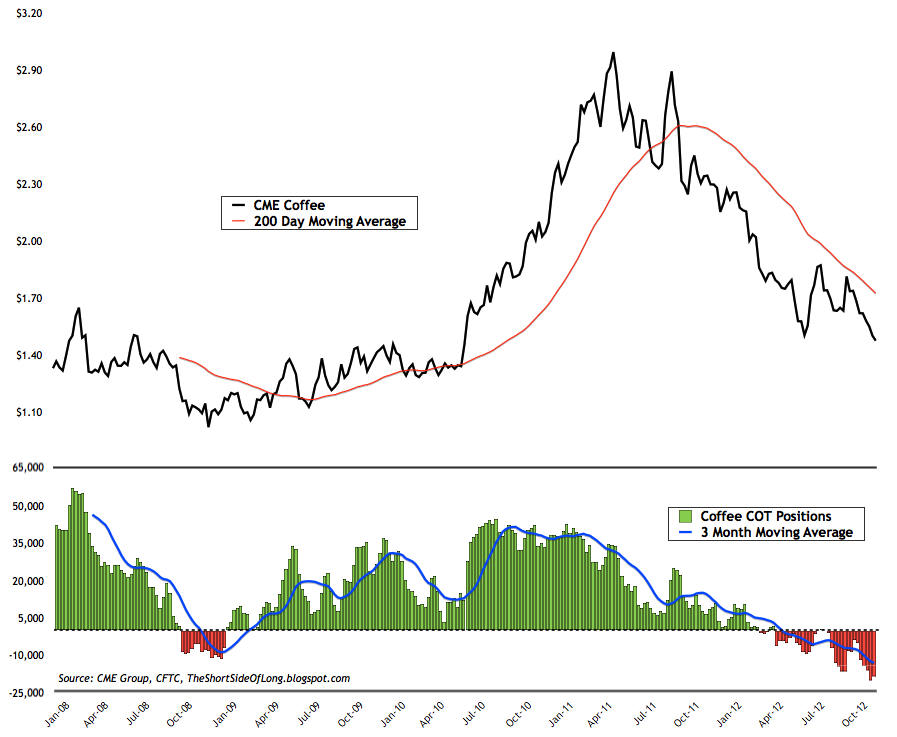
Yes in the Agricultural Softs. Hedge funds are negative on all three major Softs, which include Cotton, Coffee and Sugar. Recent Coffee positioning shows that bearish bets remain near record high levels, while...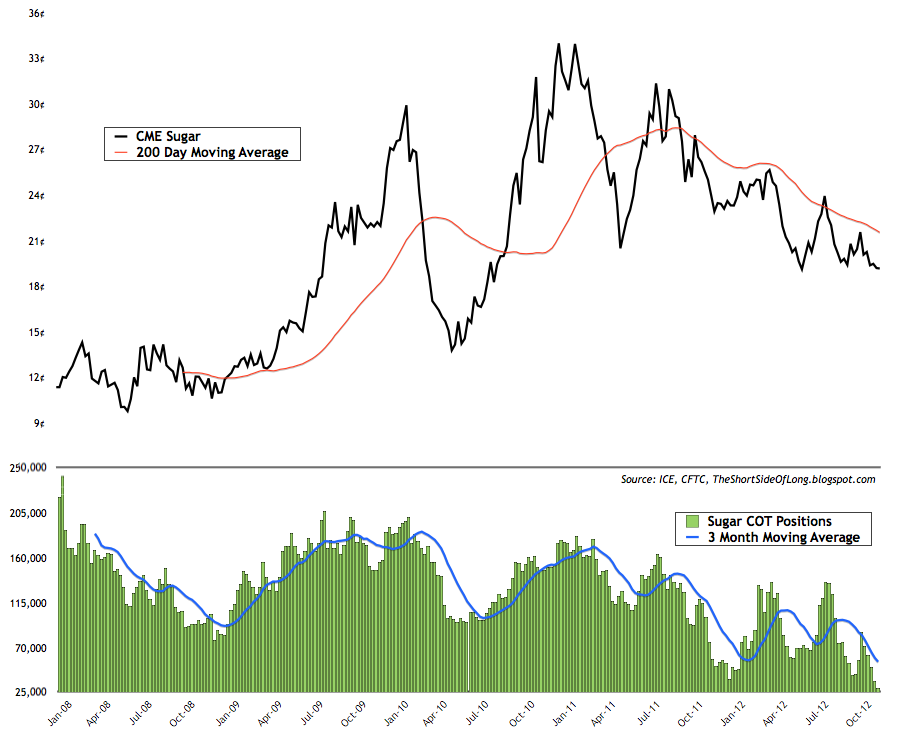
... hedge fund Sugar positioning is now the lowest in almost five years. I think a major bottom in the Sugar market is approaching and that is what deserves my attention and my capital. Long term purchases of Soft commodities could return handsome gains in coming quarters and years.
Trading Diary (Last update 16th of November 12)
- Economic Outlook: The global economy continues to slow towards a recession, as we find ourselves in the very late cycle of the expansion. United States growth remains below 2% for five out of the last six quarters, with durable goods new orders collapsing recently. The Eurozone remains in a recession, as Germany dangerously flirts with a contraction in growth. German CEOs see the business cycle moving deeper into a downturn with a high probability of recession. Japanese growth rates are once again anaemic post the earthquake recovery, with Industrial Production slowing meaningfully. Chinese growth continues to slow for the seventh quarter in a row, however many do not believe official growth data. Business confidence is decreasing rapidly, while the manufacturing sector has been in a doldrum for a year, confirmed by the slowest electricity consumption since 2009. More importantly the price of cement, iron ore and steel has crashed recently, indicating the end of the property building boom. Finally, exports are now slowing rapidly, while railway cargo freight is looking very weak.
- Equities: Short positions are held in various US equity sectors, which include Dow Transports (IYT), Technology (XLK), Discretionary (XLY) and Industrials (XLI). Large put options have been bought on Apple (AAPL). Call options have been sold on Homebuilders (XHB), JP Morgan (JPM), Amazon (AMZN), IBM (IMB), Commonwealth Bank (CBA), Adidas (ADS) and others.
- Bonds: There isn't a lot of exposure in the bond space, as we believe this sector is experiencing euphoric investor demand. Call options have been sold on Junk Bonds (HYG). We plan to short Long Bond Treasuries (TLT) in due time.
- Currencies: Long positions are held in Japanese Yen (FXY). Put options have been bought on British Pound (FXB) & Canadian Dollar (FXC). Put options have been sold on Japanese Yen (FXY).
- Commodities: Long positions are held in various commodity sectors, which include Silver (SLV, SIVR, PSLV, Comex futures), Agriculture (RJA, JJA) and Sugar (SGG). We plan to increase longs in PMs and Softs in due time.
