Aside from an absolute cracker of a game in Queensland’s win in Origin, the focus in Europe was squarely on the GBP, with an eye also on whether Brent or US crude could pull off some sort of turn around.
The Queens speech naturally got media focus, but it was Bank of England Chief economists Andy Haldane who caused a stronger reaction in the GBP, with a fairly hawkish assessment on policy tightening, suggesting he is considering voting for a hike sometime this year.
In the rates market, we can see a decent sell-off in short-sterling futures (the June 2018 contract gained nine basis points) and we are left with markets pricing in a 50% chance of a hike from the BoE by year-end. This seems fair, although the market can’t really make up its mind in the absence of any real clarity around the Brexit negotiations, and we haven’t even got a government in place yet.
EUR/USD has also attracted some buying activity through US trade, while AUD/USD has looked soggy trading in a range of $0.7575 to $0.7543 through European and US trade. That despite a solid rally in bulk commodities, with spot iron ore closing up 0.7%, while a better day was seen in Dalian futures exchange with iron ore, steel and coking coal futures gaining 3.6%, 1.5% and 3.8% respectively.
The NZD has had its traditional whippy moves in the wake of the RBNZ statement, although we haven’t heard anything new, and all we have seen with the NZD rallying on the statement is a market who was positioned on the dovish side of the ledger and the language has largely looked through some of the weaker data points.
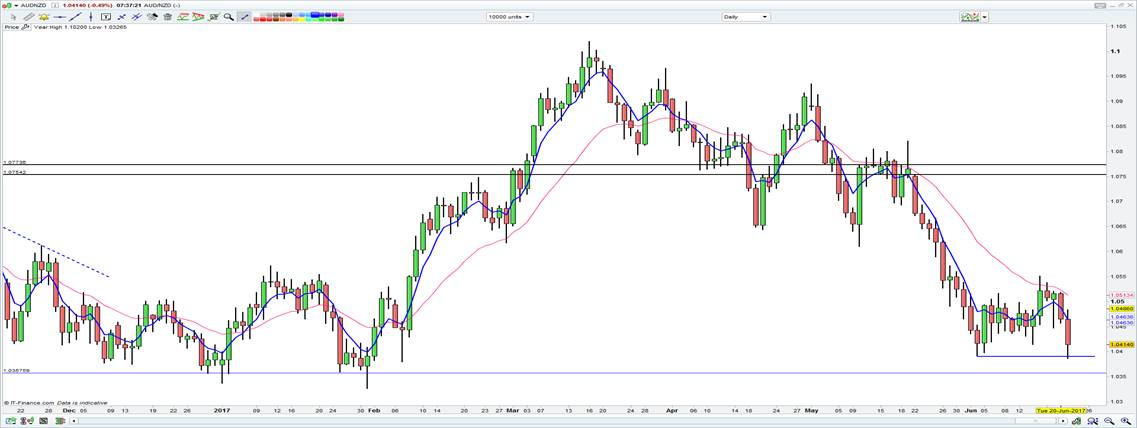
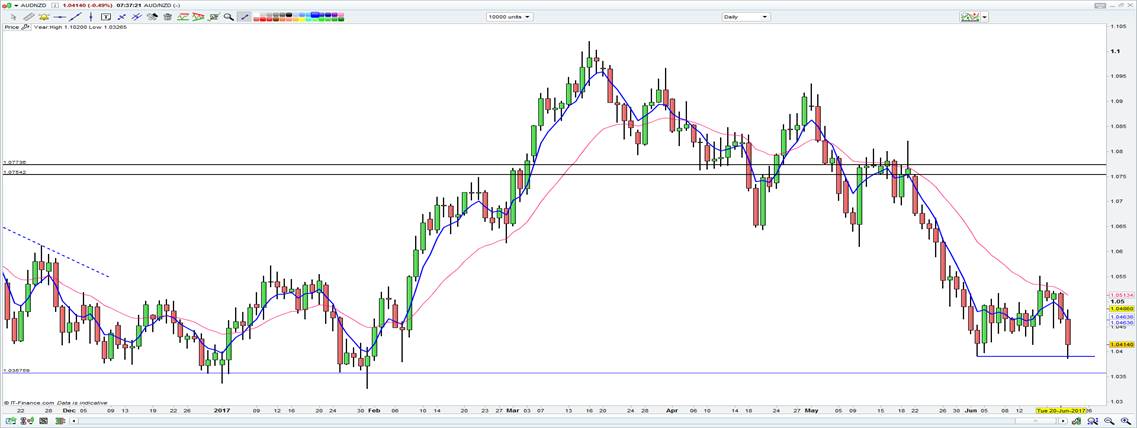
Keep an eye on AUD/NZD and while we saw a move through a$1.0400 the buying we are seeing from the figure has put an ominous looking double bottom in play.
The headlines though through the US session has been around moves in the oil markets. We saw a 2.451 million and 578,000 barrel drawdown in crude and gasoline inventories respectively, while we also saw a 0.4% decline in the utilisation rate. Relative to expectations these numbers are bullish for oil, yet the small pop in crude was sold into instantaneously and this tells you all you need to know about sentiment - it's shot to pieces.
The time for contrarian trades in oil is fast approaching, but I would want to see some stability in price and the technicals start to become more convincing. Aside from the barrage of headlines of ‘bear market’ in various media publications we can see high yield credit spreads starting to widen here, which should, in theory, should be a headwind for further increases in the US rig count.
We are seeing the options skew falling suggesting less demand to hedge future production and noises are being made from certain camps in OPEC. Overnight this notably included the Iranian oil minister who detailed that some OPEC countries are “discussing deepening their production cut agreement”. And so the jawboning begins in earnest.
(Red line = High yield CDS index, white line = S&P 500 - Inverted, yellow histogram = % change on the day in the HY CDS) – A further move higher in this HY index could be taken badly by equity.
I think it is also positive that despite the moves in oil we haven’t seen the bond markets pricing of inflation expectations budge in the past two days and we can see both nominal US bond yields and ‘real’ yields unchanged on the session. Certainly, many had the recent rise of ‘real’ (or inflation adjusted) bond yields on the radar, as further moves higher (in yield) represent a tightening of financial conditions and along with a widening of credit spreads could have resulted in a decent move lower in equities and a pick-up in implied volatility.
The lead for Asia is somewhat constructive, although all the buying has been seen in tech (the NASDAQ closed up 1%), with healthcare and consumer stocks performing well. The S&P 500 energy and materials sector have closed down 1.6% and 1.1% respectively and this doesn’t bode well for these sub-sectors on the ASX 200. That being said, I feel we should see BHP open modestly on the front foot, while Vale’s US-listing has closed up 2.3% in-line with the strong moves in bulks.
The 30-day rolling correlation between FMG (and other iron ore plays) and Vale is not particular high at the moment, so Vale’s close may be a touch misleading, but given the pick-up in shorting activity seen in FMG we may see a few looking to cover. Others will be pointing to FMG’s daily chart and see the breakout of the May/June lows and see this chart looks textbook for further downside and about as bearish as you will see in the market.
SPI futures have closed up 16 points, thus our call for the ASX 200 cash sits closer to 5680. The ASX 200’s market internals are not given any glaring trade signals and despite the move lower in the last couple of days we can see 23% of ASX 200 stocks trading a four-week low and 12% closing below their lower Bollinger band.
When these percentages move above 45% and 35% respectively that is usually a good contrarian indicator, suggesting that too much pessimism is in the market. Either way, I would be watching financials for potential support in the broader index today, health care as this is where the leadership has been this whole year, but energy above all to see if equity investors see a turning point.


