While both German and eurozone June services PMIs beat expectations, they were weaker month-over-month. But that’s not what’s actually on euro investors’ minds.
Europe has assumed leadership of global growth. So, a PMI that's lower in a single month, especially when expected, is negligible for everyone but short-term traders. Second, what every euro denominated investor cares about are the ECB minutes. The ECB is at a crossroads, both fundamentally and technically.
When Draghi Speaks, Euro Responds
The last time ECB President Mario Draghi spoke, financial markets ended in a tizzy. Draghi began by smooth-talking the possible end of QE, mentioning the notion for the very first time. The euro surged immediately afterward, to the highest prices of the year for the single currency.
Bond investors were happy too, dumping the asset for sexier instruments, so that interest rates on two-year and five-year Bunds reached their highest levels in more than a year – all on the change of a single letter, when Draghi charmingly announced that “deflationary forces have been replaced by reflationary ones.” For investors, more romantic words were never spoken.
Afterward, when Draghi realized the euphoria his words had created, he was suddenly filled with regret, recalling the “taper tantrum” in bond markets, that, for instance, the Fed had triggered in 2013 in the US. He quickly took back his words, but, either out of cowardice or cruelty, he used an intermediary to deliver the message.
Initially the euro fell. However, soon afterward investors remembered their approval of just the possibility of tightening and pushed the euro all the way back, and then some.
Hammer Time

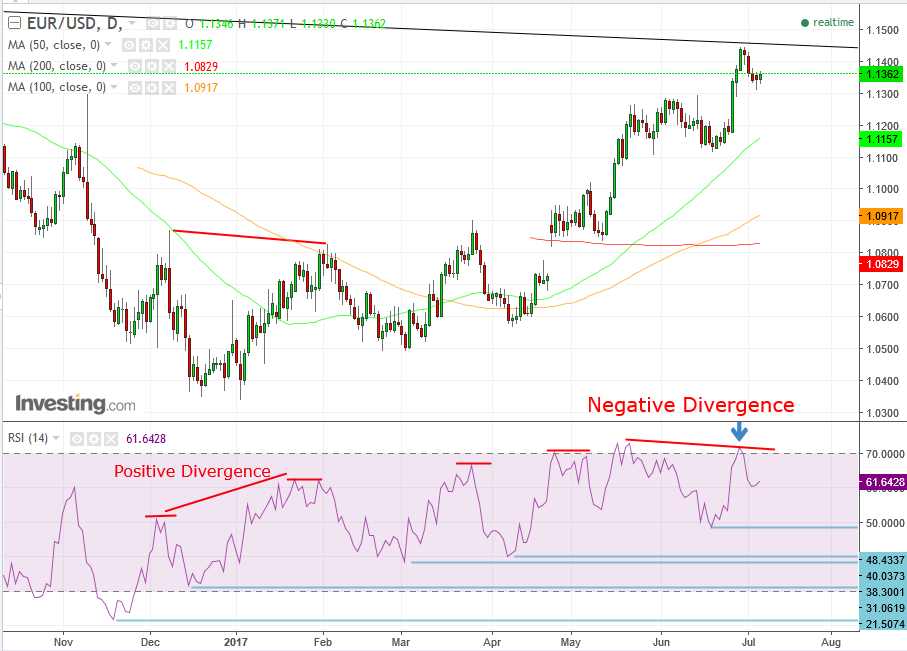
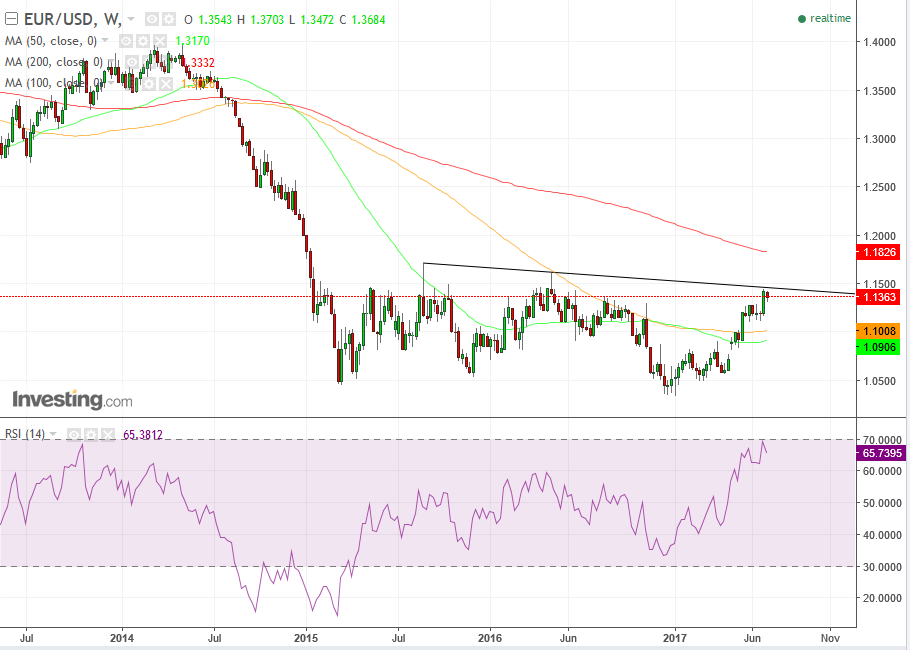
Today, the euro is on the rise, after a 4-day decline, upon reaching the long-term downtrend line since August 2015. Yesterday, the fourth day of the decline, it formed a “hammer.” If you’re not familiar with the psychology behind this pattern, it’s the bulls saying: “It’s hammer time! Can’t touch this.”
Bears who shorted the initial decline, confirming their outlook, have been horrified to see the currency rise back up. Today’s advance already either wiped out their positions, or sent them covering their shorts, which requires buying. Ironically, the bears are being forced to increase the demand that has already cost them money.
Having said that, the hammer was weak, in that it had a small upper shadow, which takes away from short losses. Still, today’s advance, to even higher levels tthan yesterday’s trading, confirms the validity of the hammer. Still, we need to remember the near-two-year downtrend line, which sent it back down, from the June 30 1.1448 high, down to the July 5 1.1313 low.
Which Trend Is Stronger?
So, which trend is stronger, the short-term, since the end if the Trump trade in December, or the one that’s two years strong? Normally, the longer the trend and the more times it’s been tested, the stronger it is, as more investors are aware of it, have been rewarded by obeying it, and having been punished for disobeying it. Still, long-term trends do shift, and what better time for it to transform into an uptrend, than when the European economy is doing better than it has since before 2008...even better than the US?
While one should keep one’s eye on the price, one should be mindful of the momentum of that price too. The RSI peak-and-trough structure has mostly mirrored that of the rising price trend, with two exceptions. The first, in December, when the RSI provided a positive divergence, its peak rising in contradiction to the falling peak of the price.
As a leading indicator, it gave the heads up that prices will rise and did they ever, rising almost 6 percent since the 1.0800 February lower peak till the 1.1400 June 30 high. Now, the RSI provided a negative divergence, when it peaked lower in July than it did in May, in contradiction to the latest rally, following Draghi’s optimistic outlook and first mention of ending QE.
Might this weaker momentum on the rise of the price suggest it’s unsustainable?

The weekly RSI has reached the most overbought it’s been since October 2014, which preceded the 25-percent decline in the ten months since May 2014 till March 2015. Something to think about.
Either which way, today’s ECB Minutes will provide trading opportunities, during and after, as proven by the last ECB meeting.
Trading Strategies
Conservative traders are likely to want to wait for a resolution between the opposing short term and long term. They might wait for a break of one or the other. On the upside, a close above the ominous psychological resistance of 1.1500, and on the downside, with a close below 1.1300
Moderate traders may go long upon reaching the support of the uptrend line, which at this angle, may coincide with yesterday’s 1.1313 hammer support; they may go short when reaching the resistance of the near-two-year downtrend line, which at this angle, may prove to coincide with the round psychological resistance of 1.1400.
Aggressive traders may go long now, placing a stop-loss beneath the support of the hammer, and take profit when reaching the uptrend line. If today’s news is positive, it might jump to it at a higher angle than 1.1400, and as much as 1.1450. It can also penetrate it on an intra-day basis, even if not close above it with a breakout.
