
The rear-view mirror continues to be kind to the major asset classes for year-to-date results. Every slice of the global markets is sitting on gains, based on a set of exchange-traded funds for 2019 performance through Friday’s close (May 24). But cracks are starting to appear in the foundation of this across-the-board rally.
As with all things predictive as it relates to market prices, an appropriate level of skepticism is required for the analysis that follows. If that caveat doesn’t send you running, then profiling momentum for the major asset classes suggests that this year’s flawless rally in everything may be peaking.
The apex of momentum doesn’t automatically lead to crashes or even widespread weakness. But for students of market cycles, the latest downtick in momentum is a factor to consider in the practice of periodic rebalancing.
Consider the chart below, which uses two metrics to quantify the degree of momentum (or the lack thereof) for 14 ETFs (list below) that serve as proxies for what we refer to on these pages as the major asset classes. The first momentum measure compares the 10-day moving average with the 100-day average, a proxy for short-term trending behavior (red line in chart below). A second set of moving averages (50 and 200 days) offers an intermediate measure of the trend (blue line). The indexes range from 0 (all funds trending down) to 1.0 (all funds trending up).
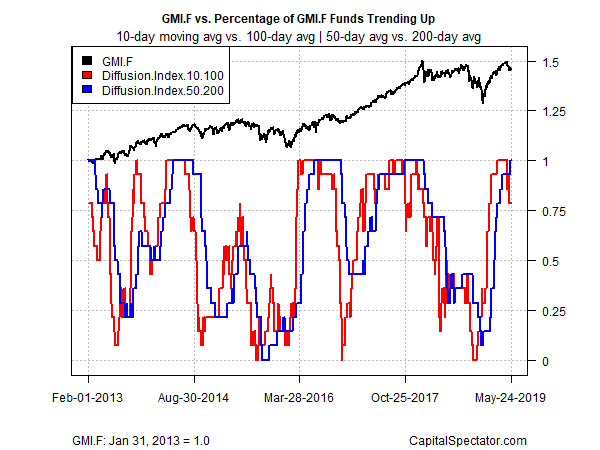
Note that the short-term indicator (red line) has fallen below its intermediate counterpart (blue line) in recent weeks. The slide represents the first time this year that short-term momentum has stumbled relative to its longer-term companion. In recent years, whenever short-term momentum has fallen below the intermediate trend (after both metrics reached maximum levels, i.e., 1.0), an ETF-based version of the Global Market Index (GMI.F) found itself in a relatively challenging period. (GMI.F is an unmanaged strategy that holds all the major asset classes, except cash, in market-value weights.)
The momentum analysis could be noise, of course, which is a back-handed way of reminding that making dramatic portfolio changes based at any single point in time, for any one reason, is almost always misguided.
Meantime, the next chart below stacks up the major asset classes (via ETFs) based on the current one-year trend. The outlier at the moment for the upside: real estate investment trusts (REITs) in the US. Vanguard Real Estate (VNQ) is higher by a strong 18.2% total return for the trailing one-year period through last week’s close. Compared with the rest of the field, that’s a magnificent gain and one that deserves careful review for portfolios that currently hold an outsized allocation in the fund or its equivalent.
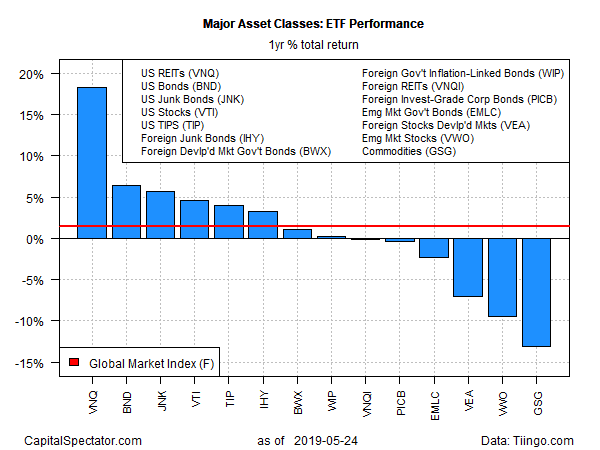
By contrast, foreign stocks and commodities (broadly defined) are hurting, based on the one-year trend. Losses via representative ETFs range from a 6.2% decline – Vanguard FTSE Developed Markets (NYSE:VEA) – to a 10.8% setback for iShares S&P GSCI Commodity-Indexed Trust (NYSE:GSG).
The momentum profile in the first chart above may or may not be relevant for estimating future risk and return writ large. Mr. Market, alas, always keeps us guessing as to which metrics are timely, or not. But after an extraordinary bull run in the first five months of 2019, it’s reasonable to wonder if this year’s across-the-board rally is heading into a more challenging period when throwing money at anything (or everything) is no longer foolproof.