Monday we talked about positive vaccine news from Pfizer (NYSE:PFE) and Moderna (NASDAQ:MRNA) holding up the market.
Friday proved the market was able to hold up through the week.

Yet Friday, many articles surfaced about the market’s health as related to the increasing state lockdowns and Covid spikes across the country.
While it’s useful to keep in touch with the news and trending market sentiment, it can also work against you if you create expectations that may not be in sync with market action.
Hence, how can we connect the news to this coming Monday's price action?
Regarding the past two week's price action we can create a good set of levels to see if doom and gloom take center stage or new highs are on the horizon.
The fact that three out of the four major indices are currently over their election range high (November 2nd-6th) is a good starting sign.
Nasdaq 100 (QQQ) is the only member that has yet to break out of its election range highs at 295.39.
If last week’s low of 288.85 doesn’t hold then we could possibly see the next move towards the 50 day moving average at 281.57.
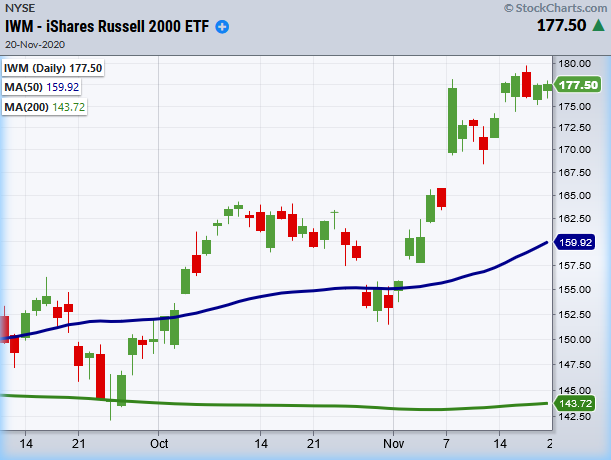
Conversely, the Russell 2000 (NYSE:IWM) is above its election range sitting close to its all-time highs of 179.72.
If it can hold over last week’s low of 174.28 then keep an eye out for a move back towards the highs.
Dow Jones (DIA) sold off this week, yet is still holding above the pivotal low post-election of 289.19.
If the market’s worries infiltrate into this Monday morning, keep a watch on this level. If not, 300 is the next key price to break to the upside.
Lastly, the S&P 500 (SPY) needs to hold above its election range of 352.19 which also gives a good support area to lean on going back to mid-October.
The market is going through a tug of war with more evidence pointing to price ignoring bad news rather than the other way around.
With a short week ahead, consumer sales will also emerge as a big headline.
The market has proven one thing-it’s not ready to give up, but it also feels like at the same time, there’s a nervous breakdown lurking in the shadows.
S&P 500 (SPY) Since it never cleared the high from a week ago, we could say the topping pattern remains until 364.38 clears.
Russell 2000 (IWM) 174.28 Support. Resistance 179.72
Dow (DIA) 289.19 next support before potential gap fill to 284.38. 300 key to clear
Nasdaq (QQQ) Closed right on the 10-DMA with major support from the 50-DMA at 281.57. 300 key to clear.
KRE (Regional Banks) 49.60 to clear. Support at 45.16.
SMH (Semiconductors) Needs to clear 202.89 with support at 196.92 the 10-DMA
IYT (Transportation) Needs to clear back over 218. 215 needs to hold.
IBB (Biotechnology) 137.01 support the 50-DMA and 143.36 Resistance.
XRT (Retail) Could be getting into overbought territory. Support 56.56
