Summary
- We expect the US Dollar Index to rally backup to 92.00 levels.
- Gold is overbought and due for a correction.
- A time for a consolidation is at hand.
Dollar Rally?
One the highlights in the news last week was the world economic forum in Davos. On Wednesday, the US dollar struck a weaker note on the basis of comments by the US Treasury Secretary Steven Mnuchin. He said, ahead of the central bank’s policy decision, that he welcomed the weaker currency when the Euro was firm. The following day, President Trump negated these comments by confirming that he wanted a strong dollar. So there seems to be some confusion in defining the future path of the US dollar as the world’s reserve currency.
Last week the dollar was under pressure on expectations that the European Bank and Bank of Japan would normalize their monetary policies. The market then broke into the next phase of the bear market with Mnuchin’s comments.
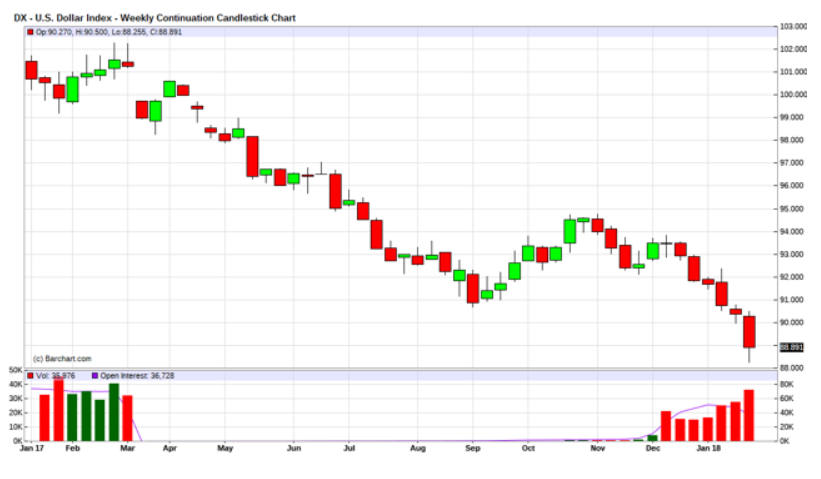
If we put aside this political rhetoric, which seems to only confuse the market even further, the fact of the matter is that the US Dollar Index made a new low on Thursday of 88.25. On Friday, the market recouped a good part of the loss from the previous day, closing at 88.89.
The condition of the dollar seems to indicate that the price has reached an extreme level below the mean and that there is a strong probability that from this oversold condition we should see a corrective rally back up to the 92.00 levels over the coming weeks.
Upon completion of this swing rally, we expect the market to come down through the month of May and make new lows during this time frame. One of the key points that we are looking at on the US Dollar Index daily chart is the March gap left at 101 before the acceleration took place that collapsed the market to the recent lows that was made on Thursday, January 25, 2018.
Gold Down?
There is a potential that if the dollar index enters into a corrective rally that could fill in the 93.50 daily gap, the price of gold would probably come down to test the average price of $1264. So we are looking at the extreme in gold above the mean, while the US dollar is at an extreme below the mean.
In a report I published on Seeking Alpha on October 24, 2017, “Gold’s Long-term Secular Bull Market is Intact,” I analyzed the 18-year gold cycle as well as the 9-year gold cycle, and the yearly supply and demand levels. At the time of the report, the price of gold closed at about $1280. One of the reasons why I’m reviewing this report is that this was the beginning of what we call a harmonic timing when the short-term aligns itself with the intermediate- and long-term trends in the market. In my experience, I have found that there is a symmetrical relationship particularly when such trends align themselves in time and price. Time is one of the important factors that measures the duration of a cycle or wave pattern in the market. The VC PMI algorithm can identify the implied volatility during a specific time frame, which identifies the average price or equilibrium of that time frame, and creates a specific structure that identifies the extremes above and below the mean. Once we are able to identify the average price, the algorithm automatically identifies the momentum of the market using specific criteria and a structure that measures the price range within the trend pattern. In identifying the average price, we can quantify the extreme above the mean and below the mean; what we call the sell 1 and sell 2, and buy 1 and buy 2 levels. Once the price action penetrates those levels, the VC PMI algorithm can, if you wish, automatically execute trades. If certain behavior in price occurs, it activates specific signals in the VC PMI to go long or short, to buy or to sell. It also identifies profit objectives above or below your position. The VC PMI identifies the wave movements of the market within a specific time frame. For example, the day trading signals we produce for our subscribers identify the daily volatility of the market and gives you a specific structure to trade with; which we also provide for weekly and monthly trades.
In these reports, I share with you the weekly and monthly reports for your benefit as a self-directed individual. I have found after more than 15 years of data testing the algorithm, that it has produced a consistent pattern of recognizing and identifying the extreme levels of the reversion to the mean or the relative implied volatility. It not only identifies those levels, it can execute trades using AI or a robot to automatically execute those trades, with remarkable results. It takes emotion out of the equation. It has shifted the profit factor from 1 to 1 to 2 or even 3 to 1, which is highly unusual.
The 18-year cycle in the October 23, 2017, report indicated that we were about to embark on the next leg up in the gold market. I identified at that time the 50-day moving average of $1235. I also reported that it had been three consecutive months that gold had closed above the 50-day moving average and gold closed above that average for the first time in four and a half years. The report identified that the long-term moving average, the 18-year moving average, was at $1270 and the fact that the market had closed above $1270 activated higher levels that seem to have materialized as of last week.
We also reported on October 23 that these signals also coincided with the 9-year cycle, which coincided with the 18-day moving average at $1270 and the 50-day moving average at $1245. The market closing at $1280 above the moving averages gave us a very strong signal that the market had activated a major long-term buy signal and that the long-term bull, which started 18 years ago in 1999, had resumed.
In order to find a short-term trading range and identify the main resistance and supply levels, we analyzed the 12-month supply and demand, which indicated for us that the long-term trend momentum for gold was bullish with targets of $1386 and $1484.
In the report, I wrote, “According to my analysis you can use the extremes above the mean as your targets, at $1386 and $1484; the sell 1 and sell 2 levels. We recommend easing out of long positions at these levels and that you take profits off the table. If the market closes below $1264, the market momentum changes from bullish to neutral.”
If we look at what happened to the market after this report, the price of gold during December came down and tested that $1238 level, with a low in December of about $1242. Once it tested the low of $1242 in December, the gold market rallied sharply making a monthly reversal to close at $1314. So the price action came down through the $1264, didn’t come down to as low as $1166, but then found tremendous support at that $1238-$1240 level to the extent that reverted back up to $1264. This then activated the upper end of the monthly targets of sell 1 and sell 2 at $1386 to $1484.

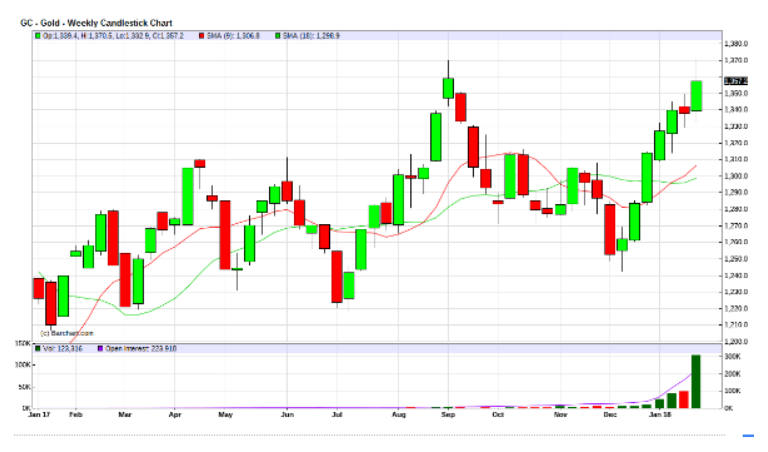
Based on our analysis using the VC PMI, we seem to be in the process of a long-term uptrend, which started October 23. With the price action as of last week making a high of $1370 for the new April futures contract, breaking above the previous high that was made in September 2017, it provides a very strong indication that the July 2016 highs are to be tested at $1387. This fits with the target of the sell 1 level that I published on October 23, 2017, of $1386. This would give us approximately a $100 profit per ounce of gold or a $10,000 profit in the futures contract since October 23, 2017.
Where do we go from here?
As I have pointed out, it seems that the market has accomplished all of our short- and intermediate-term targets, and almost all of the long-term targets, with the market reaching $1386. We recommend that you take profits and reduce your exposure to the long side of the market, since the market could revert back to the average long-term price of $1264. If the market closes below $1264 for two closes in a row, it would activate the extreme below the mean targets of $1166 to $1044. In other words, we seem to be trading at the extreme level of implied volatility above the mean. Or in using the algorithm VCPMI’s long-term sell 1 level of supply, we are at a point where the probability is 90% that from this level the market will revert back down to the mean. Or, if it trades in the range of $1386 to $1484, or closer to $1484, it increases the probability to 95% of a reversion back to the mean of $1264.
We recommended to our subscribers last week to hedge their positions in gold either by synthesizing their positions or by buying puts or selling calls, or by doing any kind of credit spread. What you do depends on your expertise as a trader, your skill and knowledge, as well as your strategy using such derivative instruments.
Supply and Demand levels for the Week

Courtesy: ema2tradelivesignals.com
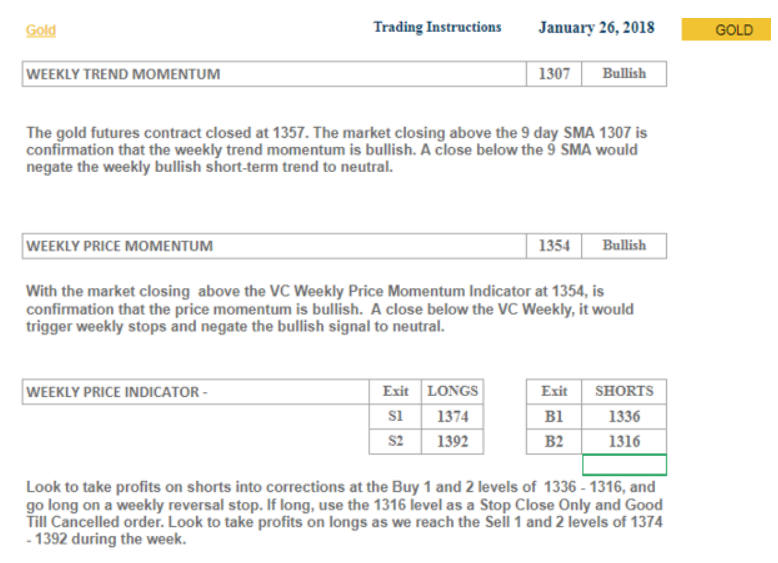
Taking a look at the current market in gold, let’s look at the supply and demand levels we have identified coming into next week. The gold market closed Friday at $1357. The first filter that we use, the 9-day moving average, continues to be bullish because the market closed above that average, which is at $1307. This validates that the trend momentum of the market is bullish because the market closed above the mean. It also tells us that if the market were to come down to below $1307, it would negate this bullishness to neutral. You can use this first filter as a stop or protective indicator based on your style of trading and your appetite for risk.
The second filter that we use is the weekly price momentum. The VCPMI identifies the average price and the momentum of that price. The close price of the market in relation to the average price identifies a trading range, which we call the extreme above or below the mean. The sell 1 level is telling us that with the market closing above $1354, it has activated weekly targets of $1374 to $1392. Closing above $1354, the price momentum next week is bullish. But if the market closes below $1354 it would negate this bullishness to neutral.
It seems that the weekly average price is moving very close to the price action of the market, which indicates an overbought condition. With the market closing below the average price, it would negate this uptrend and a second close below $1354 would activate the targets below the mean; the buy 1 level of $1336 and the buy 2 level of $1316. The algorithm tells you where to exit your short positions, which is where the trend momentum is identifying the level of demand. If the price action finds more demand than the supply, we will get a reversion back up to $1354. When the market comes down to the buy 1 and buy 2 levels, there is a 90% to 95% probability of a reversion back to the mean.
Disclaimer: The information in the Market Commentaries was obtained from sources believed to be reliable, but we do not guarantee its accuracy. Neither the information nor any opinion expressed herein constitutes a solicitation of the purchase or sale of any futures or options contracts. It is for educational purposes only.
Disclosure: I/we have no positions in any stocks mentioned, and no plans to initiate any positions within the next 72 hours.
I wrote this article myself, and it expresses my own opinions. I am not receiving compensation for it (other than from Seeking Alpha). I have no business relationship with any company whose stock is mentioned in this article.

