
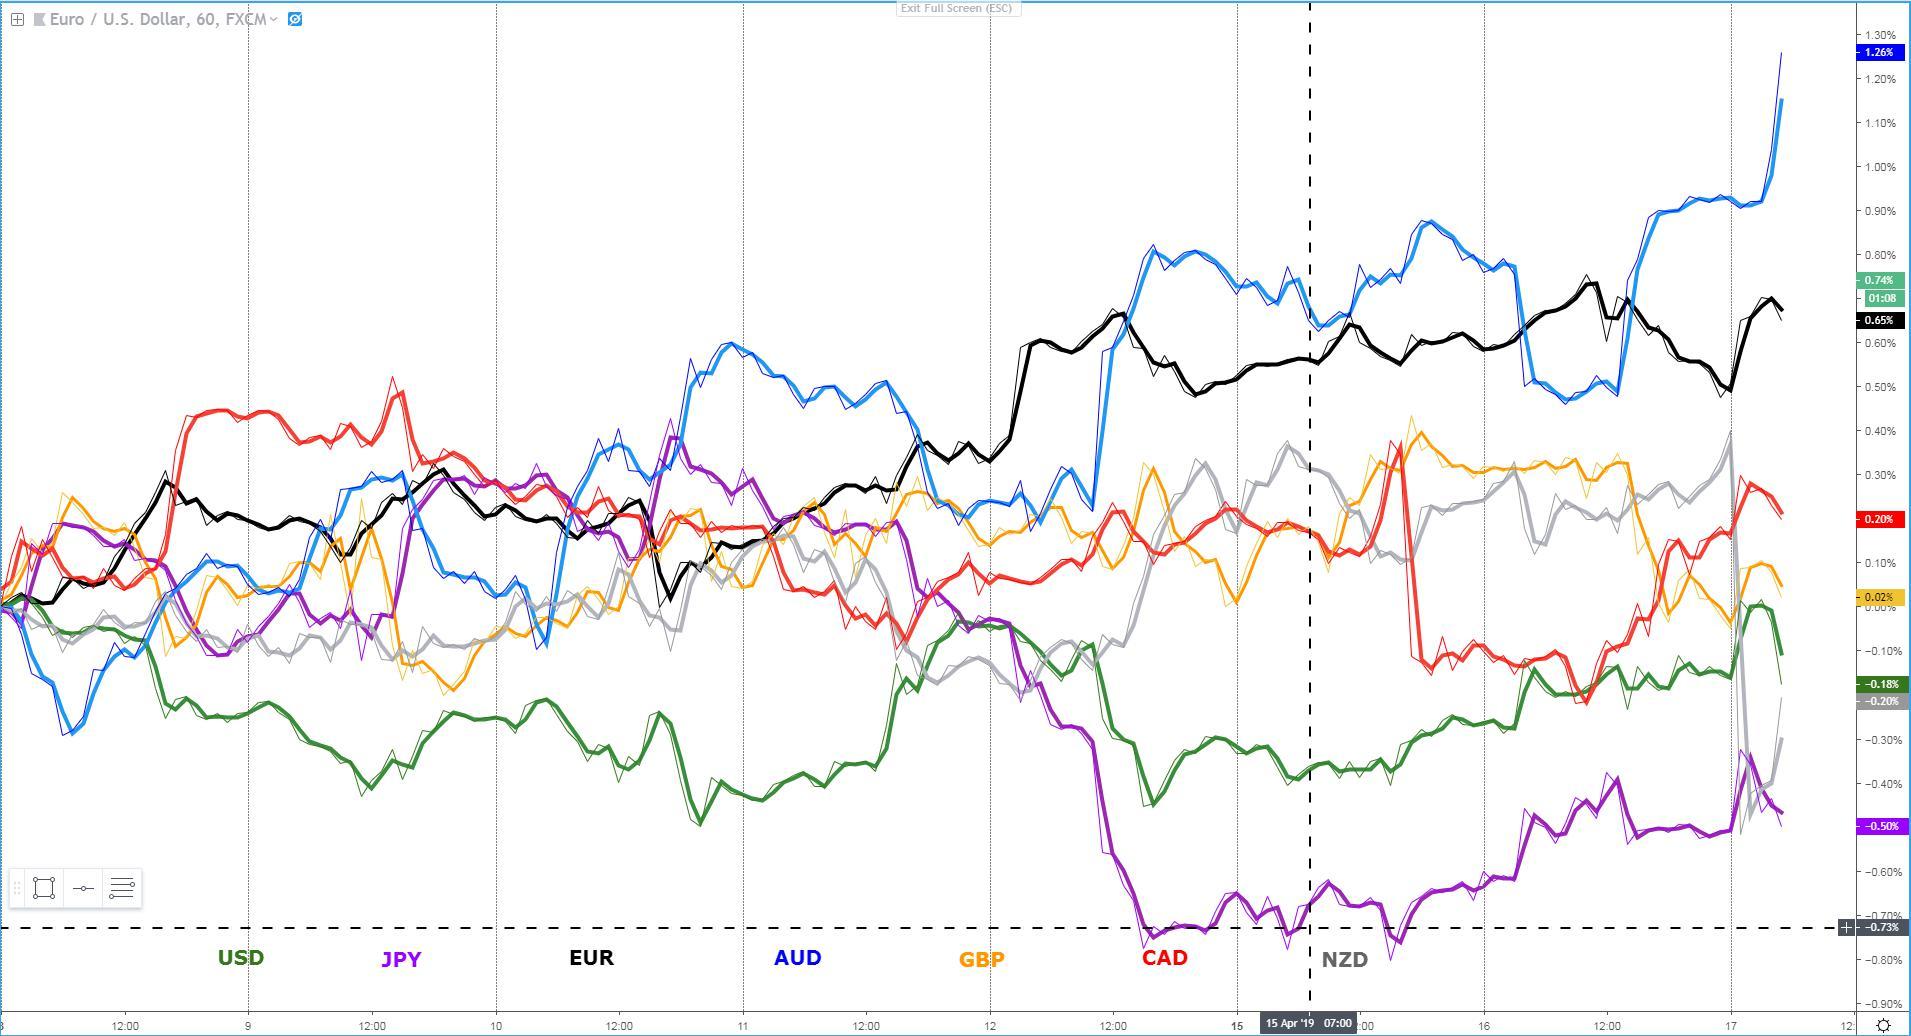
The Aussie seems to have no rival this April, as further evidence of green shoots in China, led to a new wave of buy-side pressure on the Oceanic currency. Each setback it had in the last 24h, be it via Tuesday's dovish RBA minutes or a quick round trip on lower NZ CPI, has been met with incessant buying interest, which speaks loud and clear of the current bullish outlook, mainly anchored by the growth rebound story currently underway in China. It's neighboring currency, the Kiwi, didn't enjoy the same fortunes, as the miss in the NZ CPI adds further strains to the Kiwi as the NZ Central Bank finds yet another argument to eventually cut rates. In a similar misery, in terms of drawing short-term buying interest, is the sterling, under sellers' siege as UK Labour Leader Corbyn finds no compromise with UK PM May on a Customs Union as part of amending May's Brexit deal. Looks like the extension of 6 months will give us now a time to trade the sterling under much more contained vol. The one currency that still follows, to a certain distance, the Aussie's stellar performance this April, is the euro even if it's starting to struggle above the USD 1.13 mark. Lastly, the USD and the JPY, have enjoyed a bit of a respite as stocks failed to sustain gains in the US (positive JPY) and US yields kept rising (positive USD). However, with China's optimism governing price action, the JPY and to a lesser extend the USD, may continue to struggle finding enough interest to avoid further depreciation short term.
Narrative In Financial Markets
- Notwithstanding a positive lead from Asia, mainly led by the strongest rebound in Chinese house prices since April 2017, which spurred a flurry of buying activity in European stocks, the bullish action failed to sustain in US equities after mixed earnings reports.
- US yields, with the 10y in mind, managed to retake its pre-FOMC level at 2.59% in a move that portrays market participants having decisively shifted their focus towards a pick up in growth in China as the main driver of yields as opposed to a sidelined Fed (bullish bonds).
- The rebound in the Aussie can be, in large part, attributed to RBA watcher McCrann, who writing for the Australian Herald-Sun, said the RBA is not planning to cut rates soon.
- The RBA minutes clearly shifted its bias to an easing stance. The board is now openly discussing under what scenario it would be forced to ease policy by cutting rates. The contrarian signals between growth and the labour market still warrant patience though.
- According to the Guardian, talks between UK PM May and Labour’s Corbyn are seemingly going nowhere, which has increased the downside pressure on the Sterling. The main sticking points reside in the differences about a customs union, which is the wish from the Labour.
- Interestingly, despite it has become a sideshow until Brexit is resolved, the UK employment sector continues to roar ahead, with the unemployment rate at the lowest since 1975 at 3.9%, while the upward pressure in wages prevails. The BoE would be hawkish if it wasn’t for Brexit.
- Reuters reported on a story that caused an initial selloff in the EUR as a ‘significant minority’ of ECB policymakers are now expressing a stronger pessimistic opinion towards the prospects of the EU returning to a sustainable growth path due to change of consumption habits, trade wars and the reduction of Chinese demand.
- Germany’s and EU April ZEW economic sentiment left a bitter/sweet taste as the encouraging rebound in the outlook series was overshadowed by a retreat in current conditions.
- The NZ CPI reading fails to meet expectations by coming at +0.1% vs 0.3% exp, with the yearly reading at 1.5% vs 1.7% expected. The Kiwi was immediately sold on the economic release.
- The Chinese data dump was the major event in Asia, and it lived up to the positive expectations that had been placed ever since the rebound in PMIs from last week. China’s Q1 GDP came at 1.4% (in-line) while the yearly reading stood at 6.4% vs 6.3% exp. The retail sales overshot estimates at 8.7% vs 8.4%, while Industrial production came at 8.5% vs 5.9% y/y.
Recent Economic Indicators & Events Ahead
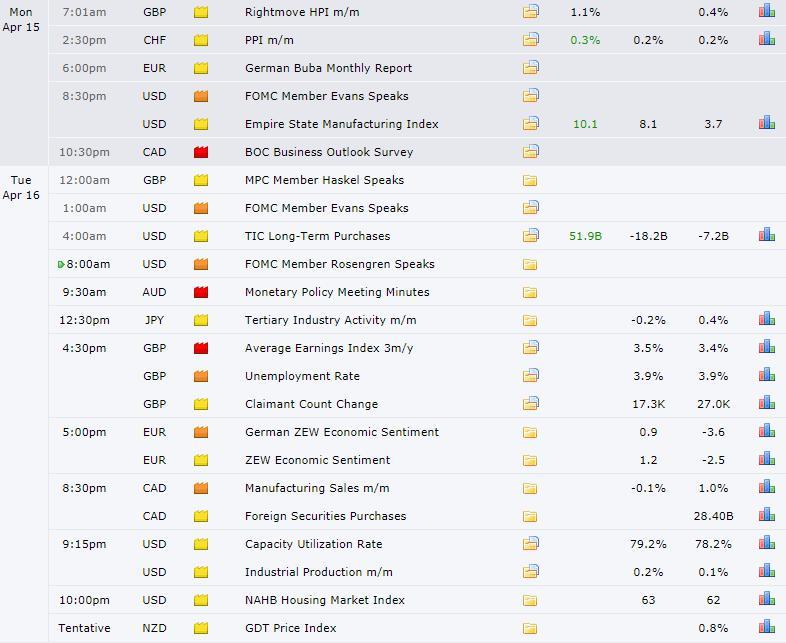
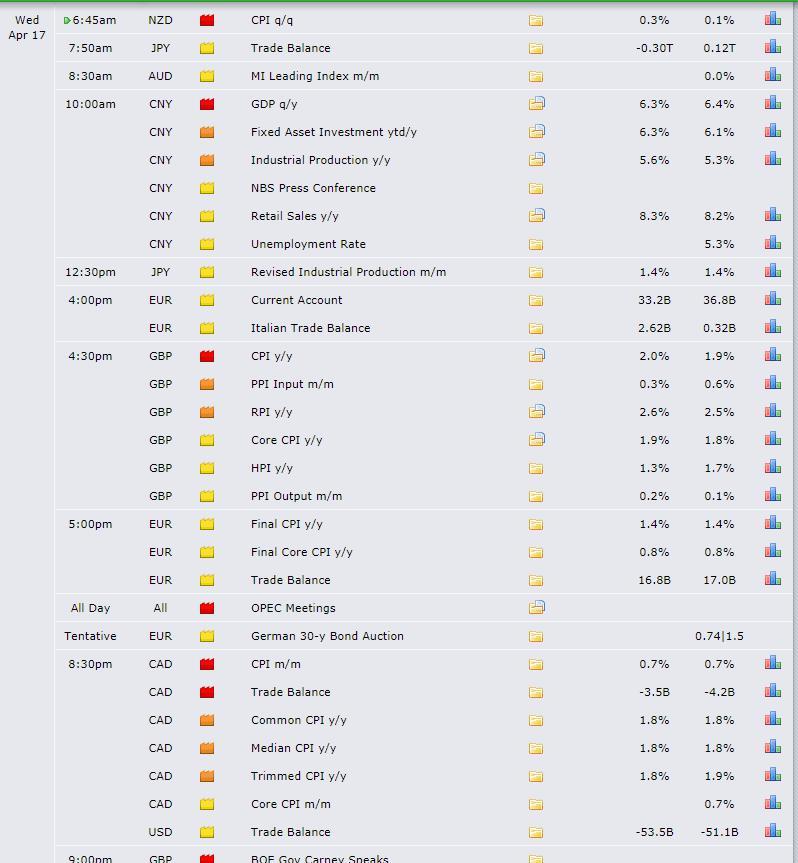
Source: Forexfactory
RORO (Risk On, Risk Off Conditions)
The rapid descent from a new year high on the S&P 500, led by a number of earning report misses as in the case of Bank of America (NYSE:BAC), has caused pockets of renewed demand in ‘risk-off’ currencies the likes of the US dollar and the Japanese yen to re-emerge. Be wary that the rise in the latter may not find much sustainability, as it happens under a context of rising global yields, with the US 30y our gauge, now testing a massive psychological level at the 3% mark. Additionally, further signs of improving Chinese data has led to equities in the far east taking a positive lead, with China at the forefront, that may extend into European and US markets.
By looking at other crosscurrents in industrial assets such as the ratio of Oil vs Gold or Copper vs Gold, both saw spikes due to the aggressive selloff in gold, which is a reflection of a market diversifying further away from the perceived safety of the precious metal at a time when US yields are on the rise in a clear bet towards additional positive news out of China, and as a ripple effect, into other global economies. Even if we look at the VIX (vol index), it hovers around the 12.00 handle, which means the implied volatility expected in stocks is very low by the no so distant standards. Credit markets in the US are perhaps the one asset class telegraphing like no other that the level of optimism to keep a bid on risk should remain fairly elevated as the HYG/IG (junk bonds vs investment grade bonds) stands.
Latest Key Technical Developments In FX Majors
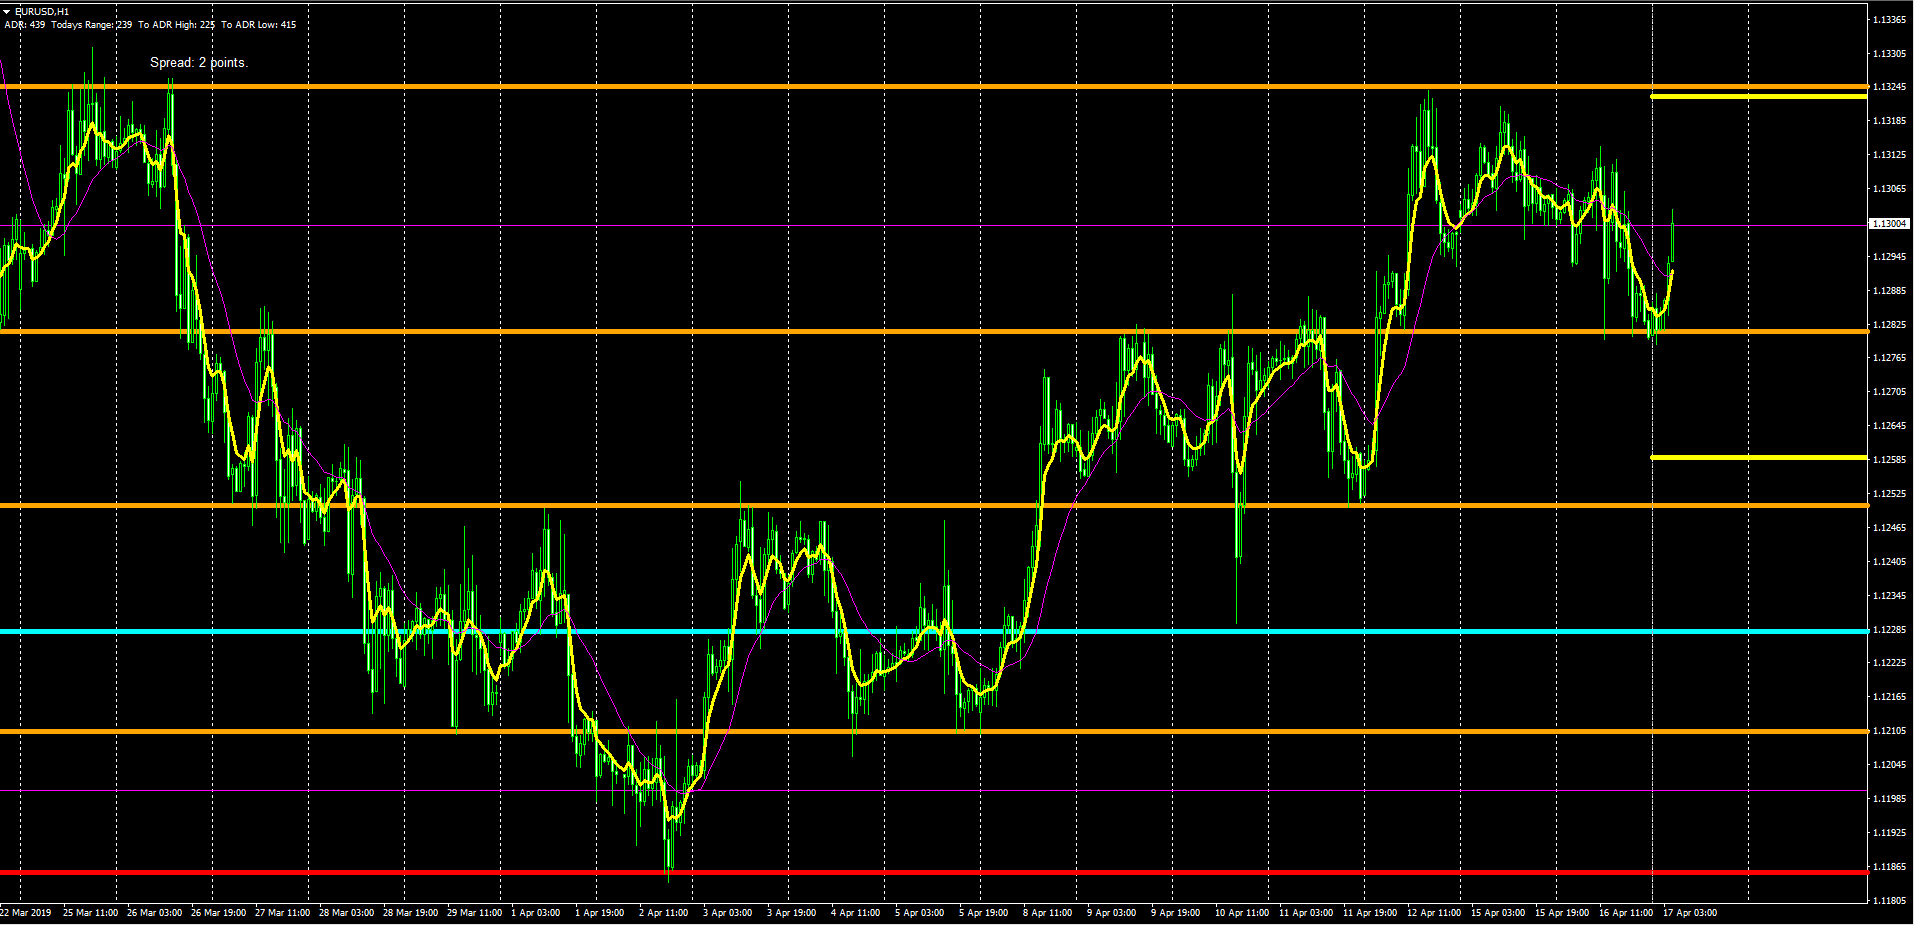
The USD was sold across the board, alongside the Japanese yen, in the Asian session. This has led to the EUR/USD exchange rate retaking the 1.13 handle after a strong rebound of a highlighted H4 horizontal support area (in orange). An area rich in liquidity around 1.1315 (Tuesday’s high) is now under siege, ahead of further liquidity pockets just a few pips ahead. It won’t be, however, until the 1.1325 area is potentially tested again, that’s where the real battle to take control of the next H4 level will take place. The inertia for today should be a USD under pressure as risk on flows resume.
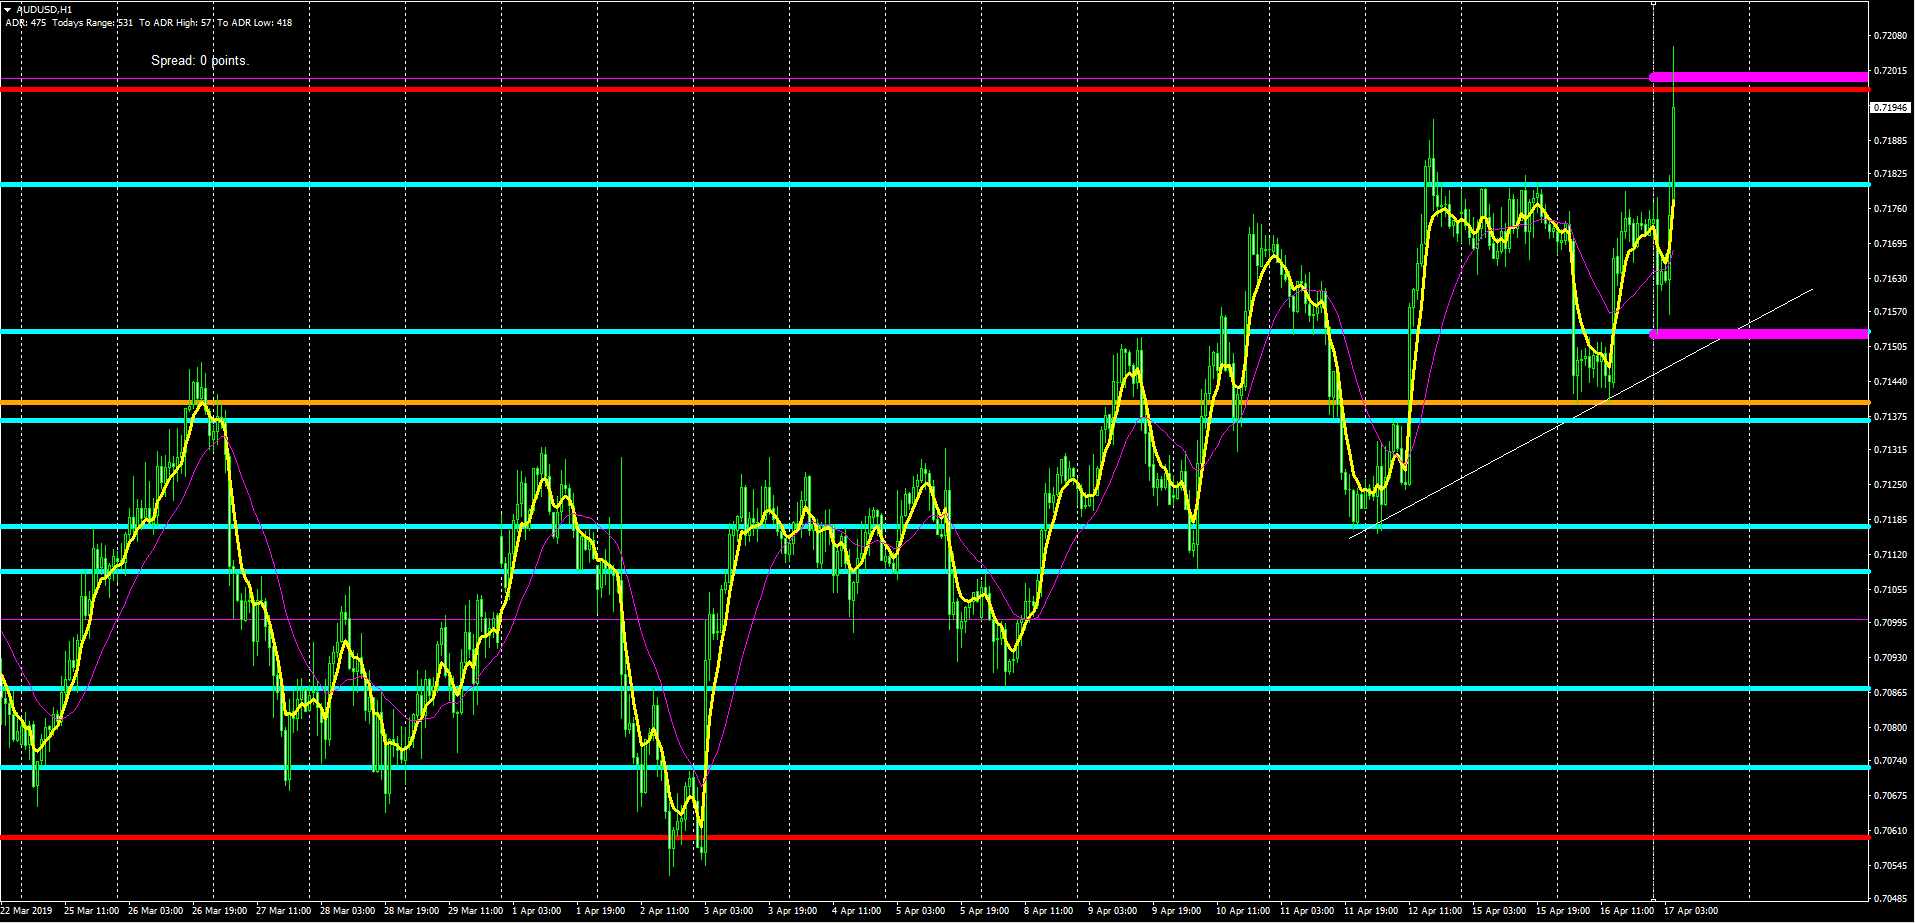
However, no currency has been re-invigorated to the extent that the Aussie has, fully recovering the NZ CPI-induced selloff in early Asia, only to rebound by its ADR full extension of 55 pips. What this means is that the rise in the AUD/USD has now landed the exchange rate at the macro level of 0.72c, an area where one would expect a major cluster of offers as the level also coincides with a daily resistance level where price failed in the last two interactions, coupled with today’s ADR limit. That said, the Chinese positive growth story should continue to keep the bid tone in the Aussie intraday, even if one must apply its own rationale to realize that the expected extension today has already been reached at the 0.72c. Note, the latest spike allows us to draw a new bullish trendline.
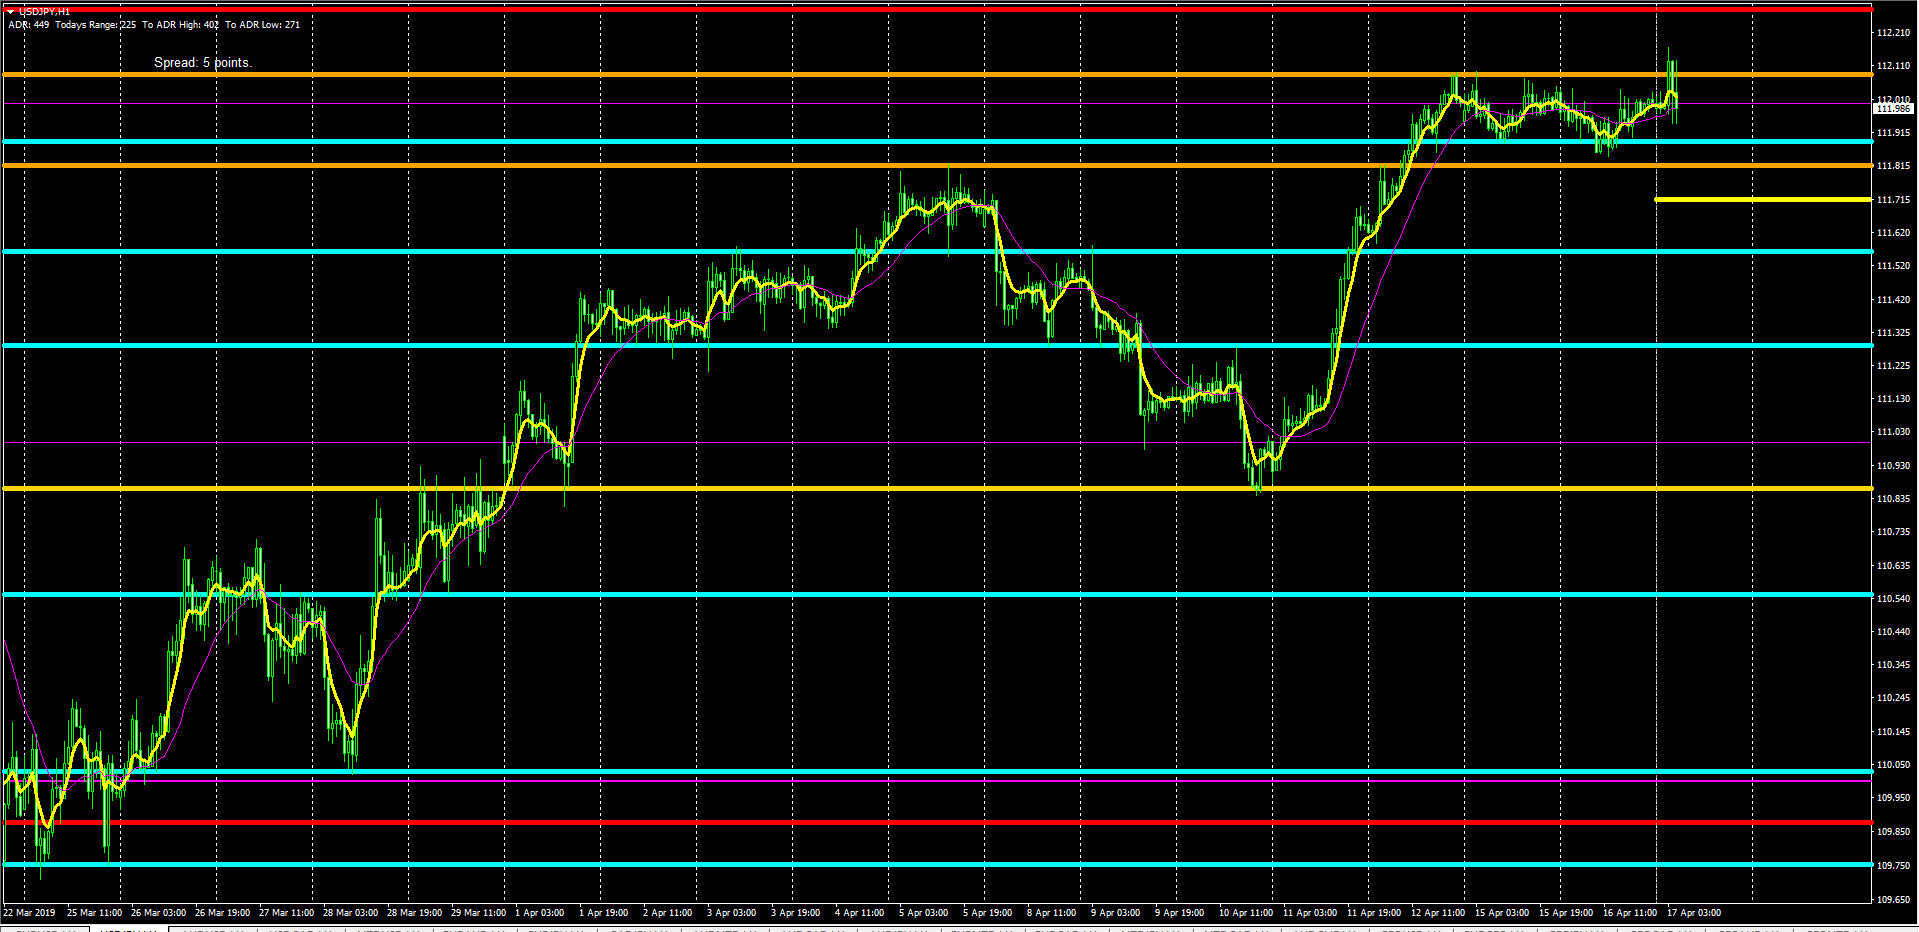
After 2 days of consolidation, the rate has filled out sellers’ offers above the 112.10 resistance, even if at the first pass the breakout has failed, taking the price back into its range midpoint. The environment remains supportive of further upward pressure as the risk appetite stands. The weakness in the DXY, judging by the renewed strength in the EUR/USD, should be compensated by rising US yields, especially if combined with a resumption of the rally in equities. It’s important to note that any setback sees two important areas of horizontal support at 111.80-90. The real macro battle in the exchange rate comes on a test of the daily resistance at 112.25-30.
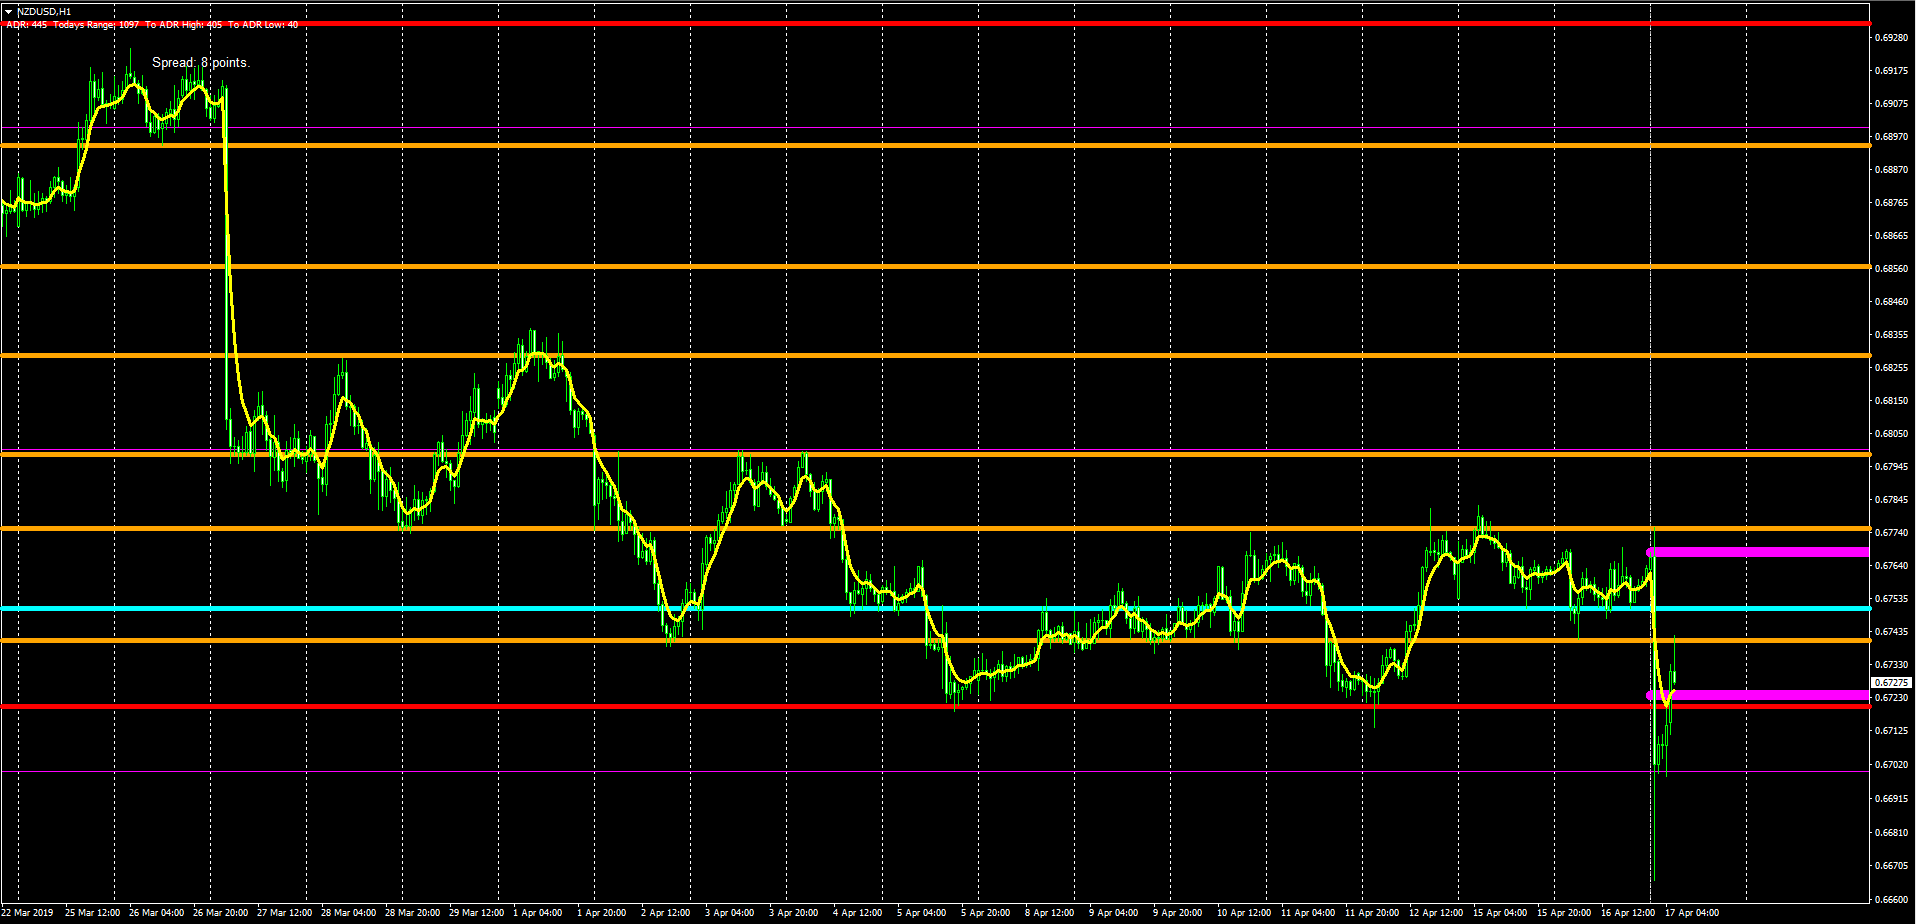
A pair attracting a lot of attention today, even if the vast of the potential extension has already occurred, is the NZD/USD. It got knocked down to grab plenty of liquidity below a level of support off the daily chart as highlighted in a red line. From there, assisted by China’s data, buyers have stepped in to initiate an intraday bullish move that may very well take us to revisit the 0.6740-50 vicinity, which is an area of resistance both on the H4 and the hourly as depicted by the blue/orange lines.
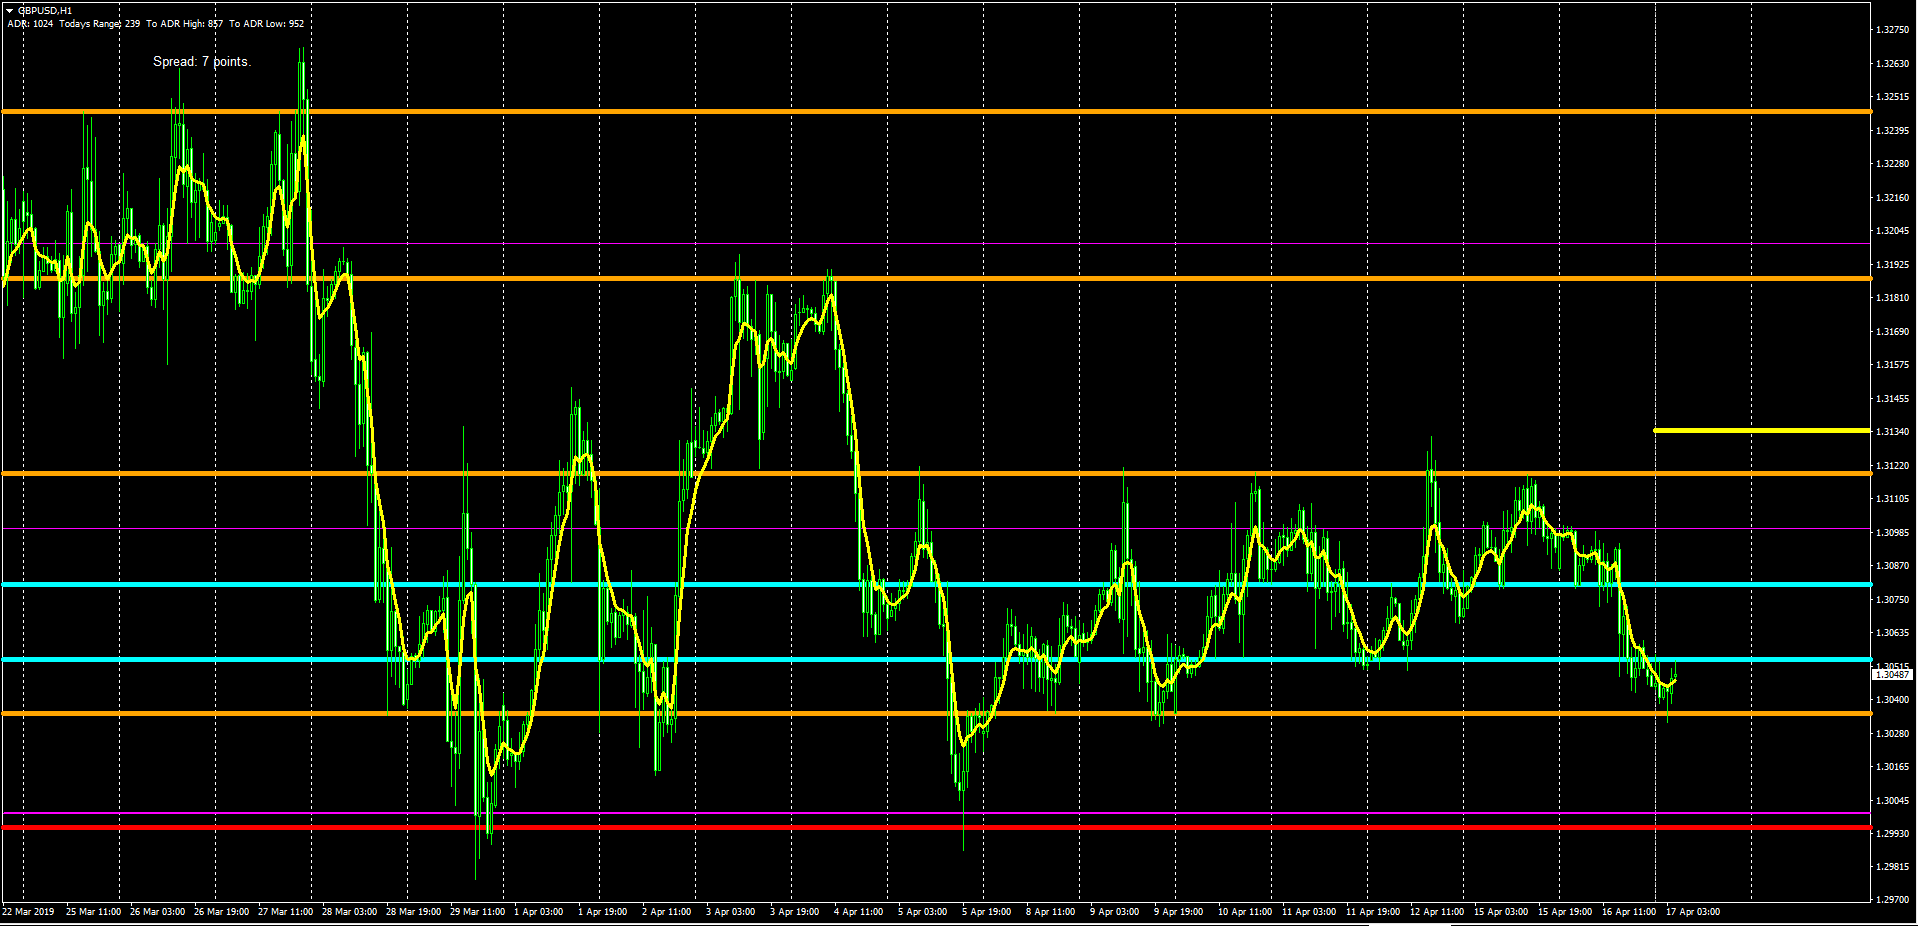
The Sterling has been under pressure as negative Brexit headlines weighed on the currency, in what ended up being a one-way street slide towards an area of important liquidity at 1.3030-35. Even if the ‘risk on’ mood is constructive for the interest of the pair, it hasn’t seen much of a rebound in Asia, which speaks loud and clear of the negative sentiment after Corbyn’s headlines. Granted, the level where the pound is currently finding demand from starts to be very attractive if you believe on the rotational nature of the pair until a new Brexit breakthrough occurs, which may be weeks away given the 6-month extension conceded by the EU. The range 1.3120-1.30 should cover the short-term eventualities, hence trading away from these levels makes technical and fundamental sense.
Important Footnotes
- Risk model: The fact that financial markets have become so intertwined and dynamic makes it essential to stay constantly in tune with market conditions and adapt to new environments. This prop model will assist you to gauge the context that you are trading so that you can significantly reduce the downside risks. To understand the principles applied in the assessment of this model, refer to the tutorial How to Unpack Risk Sentiment Profiles
- Cycles: Markets evolve in cycles followed by a period of distribution and/or accumulation. The weekly cycles are highlighted in red, blue refers to the daily, while the black lines represent the hourly cycles. To understand the principles applied in the assessment of cycles, refer to the tutorial How To Read Market Structures In Forex
- POC: It refers to the point of control. It represents the areas of most interest by trading volume and should act as walls of bids/offers that may result in price reversals. The volume profile analysis tracks trading activity over a specified time period at specified price levels. The study reveals the constant evolution of the market auction process. If you wish to find out more about the importance of the POC, refer to the tutorial How to Read Volume Profile Structures
- Tick Volume: Price updates activity provides great insights into the actual buy or sell-side commitment to be engaged into a specific directional movement. Studies validate that price updates (tick volume) are highly correlated to actual traded volume, with the correlation being very high, when looking at hourly data. If you wish to find out more about the importance tick volume, refer to the tutorial on Why Is Tick Volume Important To Monitor?
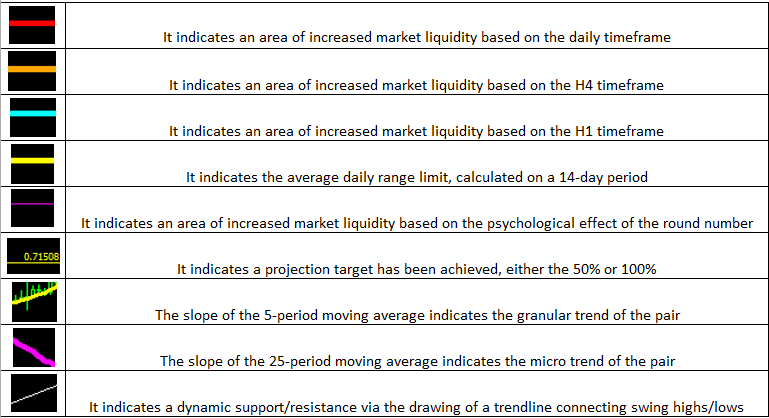
- Horizontal Support/Resistance: Unlike levels of dynamic support or resistance or more subjective measurements such as fibonacci retracements, pivot points, trendlines, or other forms of reactive areas, the horizontal lines of support and resistance are universal concepts used by the majority of market participants. It, therefore, makes the areas the most widely followed and relevant to monitor. The Ultimate Guide To Identify Areas Of High Interest In Any Market
- Trendlines: Besides the horizontal lines, trendlines are helpful as a visual representation of the trend. The trendlines are drawn respecting a series of rules that determine the validation of a new cycle being created. Therefore, these trendline drawn in the chart hinge to a certain interpretation of market structures.
- Correlations: Each forex pair has a series of highly correlated assets to assess valuations. This type of study is called inter-market analysis and it involves scoping out anomalies in the ever-evolving global interconnectivity between equities, bonds, currencies, and commodities. If you would like to understand more about this concept, refer to the tutorial How Divergence In Correlated Assets Can Help You Add An Edge.
- Fundamentals: It’s important to highlight that the daily market outlook provided in this report is subject to the impact of the fundamental news. Any unexpected news may cause the price to behave erratically in the short term.
- Projection Targets: The usefulness of the 100% projection resides in the symmetry and harmonic relationships of market cycles. By drawing a 100% projection, you can anticipate the area in the chart where some type of pause and potential reversals in price is likely to occur, due to 1. The side in control of the cycle takes profits 2. Counter-trend positions are added by contrarian players 3. These are price points where limit orders are set by market-makers. You can find out more by reading the tutorial on The Magical 100% Fibonacci Projection