Get 40% Off
👀 👁 🧿 All eyes on Biogen, up +4,56% after posting earnings. Our AI picked it in March 2024.
Which stocks will surge next?
Unlock AI-picked Stocks

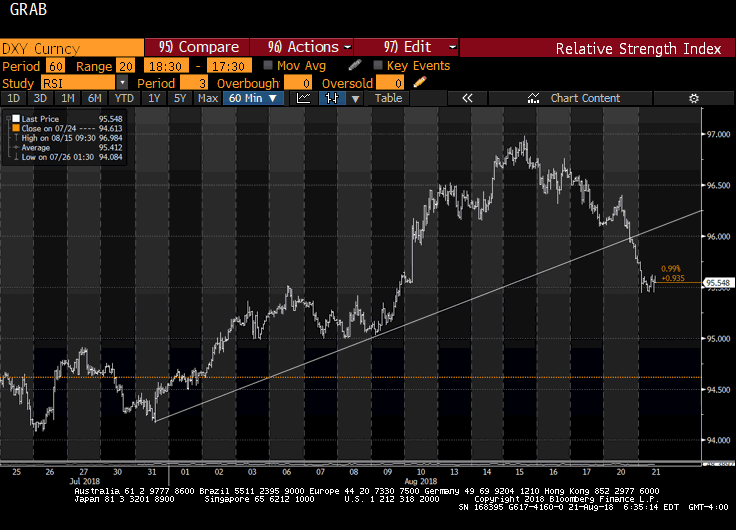
Great Graphic: Head And Shoulders Top In Dollar Index

Published 08/21/2018, 07:21 AM
Updated 07/09/2023, 06:31 AM

DXY

This Great Graphic depicts what appears to be a head and shoulders top in the hourly bar chart of the Dollar Index. The neckline is found near 96.00 and rotating the pattern along it produces a measuring objective near 95.00.

The bearish pattern was formed in the last few days, and the Dollar Index was resting near the neckline before Trump's comments gave it the push. The low today is near 95.45, which corresponds to the 20-day moving average. It has not closed below this moving average this month. After falling late yesterday and into the Asian session earlier today, the Dollar Index has been moving back and forth in a little more than a 20-tick range (95.40-95.60).

The risk is that stale longs will look at a further recovery as an opportunity to move to the sidelines, with the 95.80-96.00 likely capping the upside. The daily technical indicators are still warning that the downside correction is not over. A break of 95.00 could spur a move toward 94.00.

Latest comments

Risk Disclosure: Trading in financial instruments and/or cryptocurrencies involves high risks including the risk of losing some, or all, of your investment amount, and may not be suitable for all investors. Prices of cryptocurrencies are extremely volatile and may be affected by external factors such as financial, regulatory or political events. Trading on margin increases the financial risks.
Before deciding to trade in financial instrument or cryptocurrencies you should be fully informed of the risks and costs associated with trading the financial markets, carefully consider your investment objectives, level of experience, and risk appetite, and seek professional advice where needed.
Fusion Media would like to remind you that the data contained in this website is not necessarily real-time nor accurate. The data and prices on the website are not necessarily provided by any market or exchange, but may be provided by market makers, and so prices may not be accurate and may differ from the actual price at any given market, meaning prices are indicative and not appropriate for trading purposes. Fusion Media and any provider of the data contained in this website will not accept liability for any loss or damage as a result of your trading, or your reliance on the information contained within this website.
It is prohibited to use, store, reproduce, display, modify, transmit or distribute the data contained in this website without the explicit prior written permission of Fusion Media and/or the data provider. All intellectual property rights are reserved by the providers and/or the exchange providing the data contained in this website.
Fusion Media may be compensated by the advertisers that appear on the website, based on your interaction with the advertisements or advertisers.
© 2007-2024 - Fusion Media Limited. All Rights Reserved.