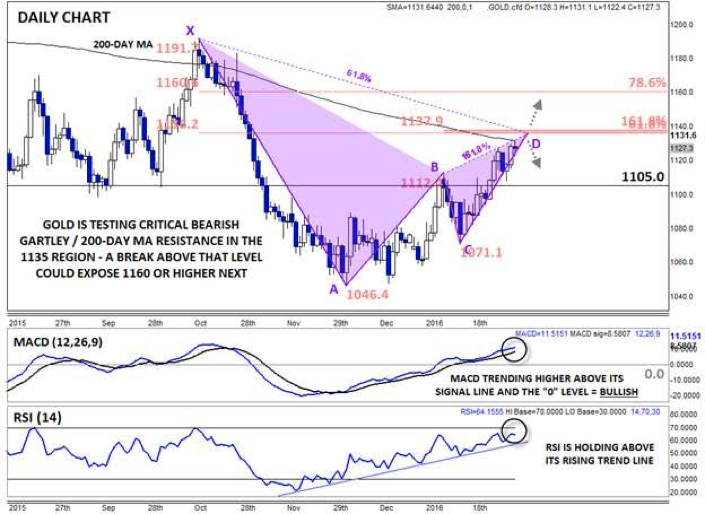
Late last week, we highlighted a rounded bottom pattern in gold, concluding that “the short-term bias in gold points higher as long as the yellow metal remains above the key 1100-1110 zone. To the topside, the key levels to watch in the coming week will be the 200-day MA at 1130, followed by the 61.8% and 78.6% Fibonacci retracements of the Oct-Nov drop at 1135 and 1160, respectively.“ After a decent rally Monday, the first resistance level has already been reached and the more we look at it, the more significant that barrier becomes.
Most importantly, the 1130-35 range represents the completion of a clear Bearish “222” Gartley pattern. This geometric pattern is named after the author (H.M. Gartley) and page number (222) of the first book to describe it (Profits in the Stock Market) way back in 1935. In essence, it helps traders identify higher-probability turning points in the market from the convergence of multiple resistance levels.
In this case, at least four significant levels all converge around 1135 on gold:
- The 61.8% Fibonacci retracement of the XA leg (1136)
- The 161.8% Fib extension of the BC leg (1138)
- An AB=CD pattern (1137)
- The 200-day moving average (1132)
With all these resistance levels congregating at the same level, a variety of technical traders could come out of the woodwork to sell gold. In that base, a pullback toward previous resistance-turned-support around 1100-05 or lower could emerge over the coming days.
Of course, any technical pattern merely identifies where there is a higher probability of a turning point or continuation, so there’s no guarantee that a top will automatically emerge off this resistance level. As the trading maxim goes, technical patterns provide points of reflection, not necessarily points of inflection. In other words, if bulls are able to drive gold through the current resistance barrier, it would be a clear show of strength that could take gold toward 1160 or above in the coming days. Readers looking to handicap one way or another may also want to keep an eye on the secondary indicators; if either the MACD or RSI show signs of rolling over and ending their uptrends, the price of gold could quickly follow.

Source: FOREX.com
