Gold for Tuesday, May 27, 2014
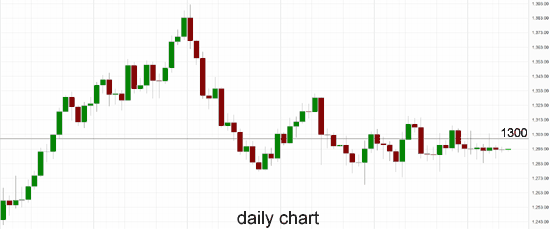
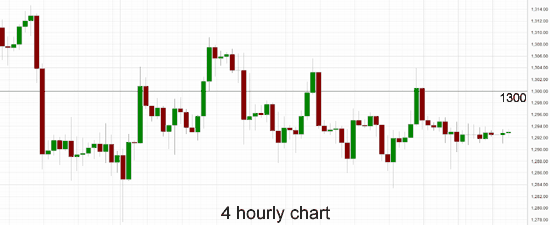
Over the last week gold has remain fixated on the $1293 level and done very little as volatility has dried up completely, resulting in gold moving very little. It pushed down towards $1280 before sling-shotting back and also had an excursion above $1300 for a short period before moving quickly back to the $1293 area again. Over the last few weeks, gold has eased back from around $1315 to establish its current narrow trading range below $1295. It continues to try to rally higher back to the resistance level at $1300. The support level at $1275 remains firm and forms the bottom area of a potential large descending triangle.
Over the last couple of months the $1275 level has established itself as a level of support and on several occasions has propped up the price of gold after reasonable falls. Throughout the second half of March gold fell heavily from resistance around $1400 back down to a several week low near support at $1275. Both these levels remain relevant as $1275 continues to offer support and the $1400 level is likely to play a role again should gold move up higher. Through the first couple of months of this year, gold moved very well from a longer term support level around $1200 up towards a six month higher near $1400 before returning to its present trading levels closer to $1300.
Gold was little changed on Tuesday as investors await U.S. economic data for directional cues, while platinum group metals rose for a second day as labor strikes dragged on in key producer South Africa. Spot gold was flat at $1,292.40 an ounce by 0027 GMT. The metal has been trading in a tight range in the last few sessions, struggling to get past $1,300. Investors were also eyeing developments in Ukraine, after it launched air strikes and a paratrooper assault against pro-Russian rebels who seized an airport on Monday. Ukraine's newly elected leader rejected any talks with "terrorists" and said a robust military campaign in the east should be able to put down a separatist revolt in "a matter of hours".
Gold May 27 at 02:55 GMT 1293.3 H: 1293.5 L: 1291.1
Gold Technical
| S3 | S2 | S1 | R1 | R2 | R3 |
| 1280 | 1275 | --- | 1315 | 1330 | --- |
During the early hours of the Asian trading session on Tuesday, gold is continuing to consolidate and trade in a small range between $1291 and $1294 after moving strongly lower from above $1305 a couple of weeks ago. Current range: trading right between $1290 and $1295 around $1293.
Further levels in both directions:
• Below: 1280 and 1275.
• Above: 1315 and 1330.
OANDA's Open Position Ratios
(Shows the ratio of long vs. short positions held for gold among all OANDA clients. The left percentage (blue) shows long positions; the right percentage (orange) shows short positions.)
The long position ratio for gold has moved back below 70% again as gold remains around the $1295 level. The trader sentiment remains in favour of long positions.
Economic Releases
- 08:30 UK BBA Mortgage Approvals (Apr)
- 12:30 US Durable goods orders (Apr)
- 12:30 US Durables ex defence (Apr)
- 12:30 US Durables ex transport (Apr)
- 13:00 US FHFA House Price Index (Mar)
- 13:00 US S&P Case-Shiller Home Price (Mar)
- 14:00 US Consumer Confidence (May)


