Get 40% Off
👀 👁 🧿 All eyes on Biogen, up +4,56% after posting earnings. Our AI picked it in March 2024.
Which stocks will surge next?
Unlock AI-picked Stocks

Gold Under Bearish Pressure: The 161.8% Retracement

Published 02/27/2017, 04:00 AM
Updated 07/09/2023, 06:32 AM
  • Gold is up 3.6% for the month
  • Gold is up $100 since January the 1st

  • Gold opened the week inside of a consolidation zone at the top of the move from last week. This doesn´t mean much until we look at the levels price has hit and last week, interestingly enough price hit the $1260 bar where bulls quickly took profit and price is now $6 off those highs.
    Why is this level so important?

    First of all the 1260 is a big psychological level which means that we are bound to see some thick action around it. Secondly, if you look at the daily chart that level is a pretty solid base in historic price action. A retest of that previous base as resistance is expected (trading 101).

    But I like to see beyond those levels, I like to see inside a nice trend like this one and look at it´s cycles. Here´s the 4H chart
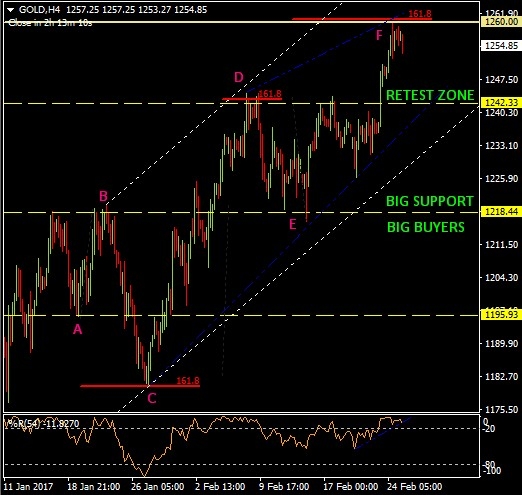
    Gold 4 Hourly Chart


    Firstly, the A-B-C-D-E-F annotations on my chart are not wave counts; they´re there to make it easier to explain the cycles I´m looking at.

    • If you notice Gold always retraces at the 161.8%:
    • Point C of rally is the 161.8% retracement of the AB move.
    • Price then goes and rallies $64 to point D which is the 161.8% of the BC move.
    • At this point price retraces and test a previous base to point E to rally $45 to the F point which is the 161.8% of the DE move.


    This is where we are right now retracing from the $1260 and 161.8% (F) back to test a previous base just like we did in the DE move. If this cycle in price continues it would mean that the next point (point G) would be at the previous base at around the $1242 level.
    I¨m not trying to predict future price action but this is the spot I´m looking at to jump in. Trade safe.

3rd party Ad. Not an offer or recommendation by Investing.com. See disclosure here or remove ads .

Latest comments

Risk Disclosure: Trading in financial instruments and/or cryptocurrencies involves high risks including the risk of losing some, or all, of your investment amount, and may not be suitable for all investors. Prices of cryptocurrencies are extremely volatile and may be affected by external factors such as financial, regulatory or political events. Trading on margin increases the financial risks.
Before deciding to trade in financial instrument or cryptocurrencies you should be fully informed of the risks and costs associated with trading the financial markets, carefully consider your investment objectives, level of experience, and risk appetite, and seek professional advice where needed.
Fusion Media would like to remind you that the data contained in this website is not necessarily real-time nor accurate. The data and prices on the website are not necessarily provided by any market or exchange, but may be provided by market makers, and so prices may not be accurate and may differ from the actual price at any given market, meaning prices are indicative and not appropriate for trading purposes. Fusion Media and any provider of the data contained in this website will not accept liability for any loss or damage as a result of your trading, or your reliance on the information contained within this website.
It is prohibited to use, store, reproduce, display, modify, transmit or distribute the data contained in this website without the explicit prior written permission of Fusion Media and/or the data provider. All intellectual property rights are reserved by the providers and/or the exchange providing the data contained in this website.
Fusion Media may be compensated by the advertisers that appear on the website, based on your interaction with the advertisements or advertisers.
© 2007-2024 - Fusion Media Limited. All Rights Reserved.