
Main scenario:
The pair is trading along an downtrend.
The downtrend may be expected to continue while pair is trading below resistance level 1253, which will be followed by reaching support level 1235.
Alternative scenario:
An uptrend will start as soon, as the pair rises above resistance level 1253, which will be followed by moving up to resistance level 1270.
Support and Resistance levels:
Supports: 1235 (strong)
Resistances: 1253 (main), 1270 (strong)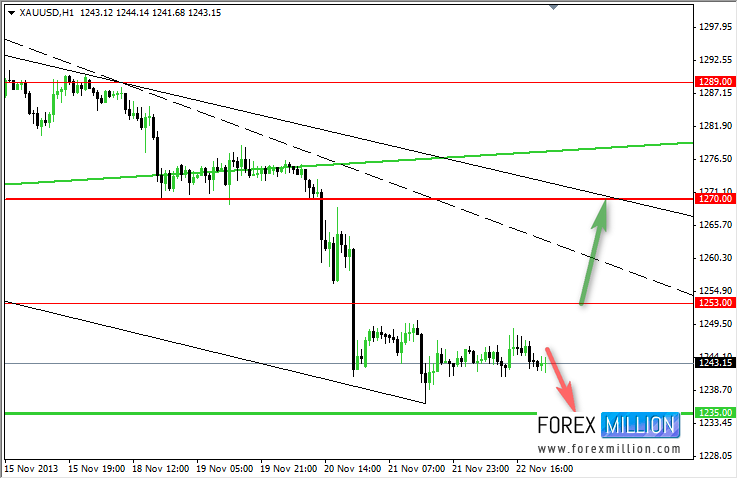 XAU/USD Hour Chart" title="XAU/USD Hour Chart" width="739" height="480">
Previous forecast: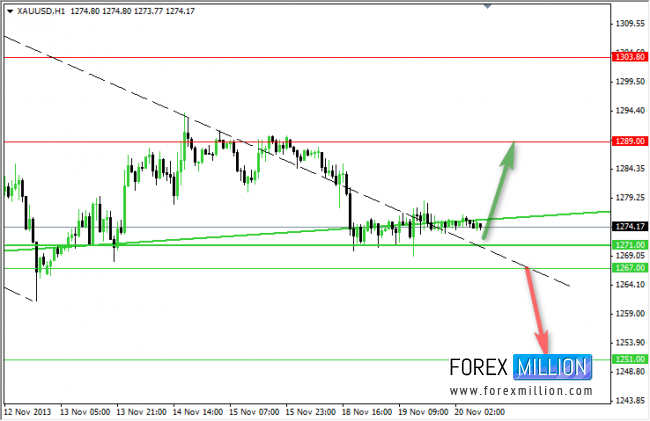 XAU/USD Hour Chart" title="XAU/USD Hour Chart" width="739" height="480">
Weekly Forecast, 25 - 29 November
Main scenario:
The pair is trading along an downtrend.
The downtrend may be expected to continue in case the market drops below support level 1235, which will be followed by reaching support level 1200.
Alternative scenario:
An uptrend will start as soon, as the pair rises above resistance level 1253, which will be followed by moving up to resistance level 1270 and then to 1289.
Support and Resistance levels:
Supports: 1235 (main), 1222, 1200 (strong)
Resistances: 1253 (main), 1270 (strong), 1289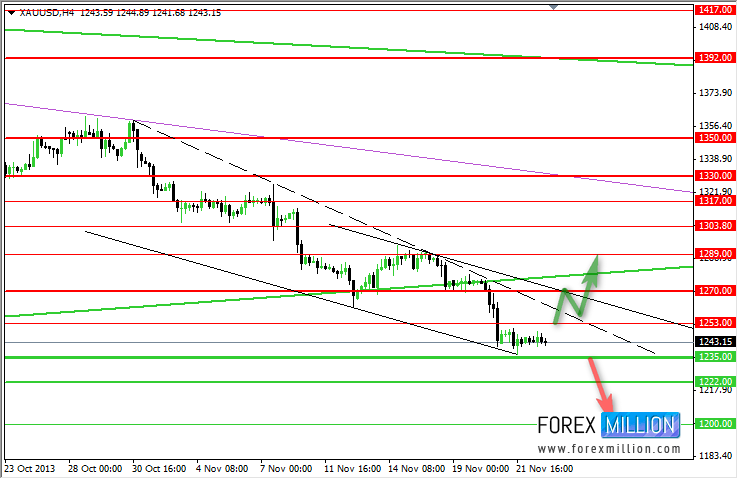 XAU/USD Hourly Chart" title="XAU/USD Hourly Chart" width="739" height="480">
Previous forecast: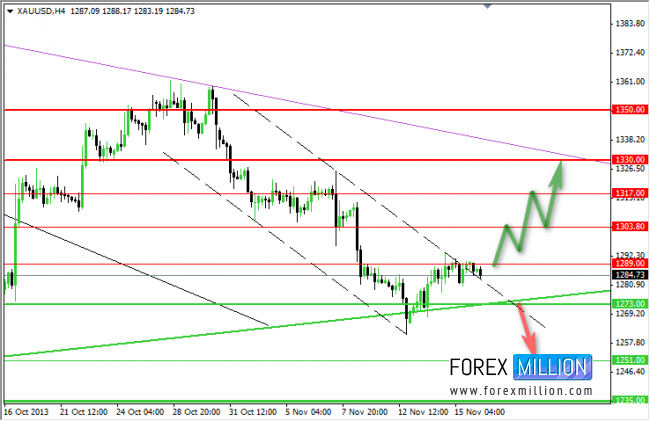 XAU/USD Hourly Chart" title="XAU/USD Hourly Chart" width="739" height="480">
Monthly forecast: November - December
Main scenario:
The pair is trading along an sideways trend
A downtrend will start as soon, as the pair drops below support level 1309, which will be followed by moving down to support level 1272 and if it keeps on moving down below that level, we may expect the pair to reach support level 1225.
Alternative scenario:
An uptrend will start as soon, as the pair rises above resistance level 1330, which will be followed by moving up to resistance level 1392.
Support and Resistance levels:
Supports: 1309 (main), 1271 (strong), 1225 (strong)
Resistances: 1330 - 1350 (main), 1392 (strong)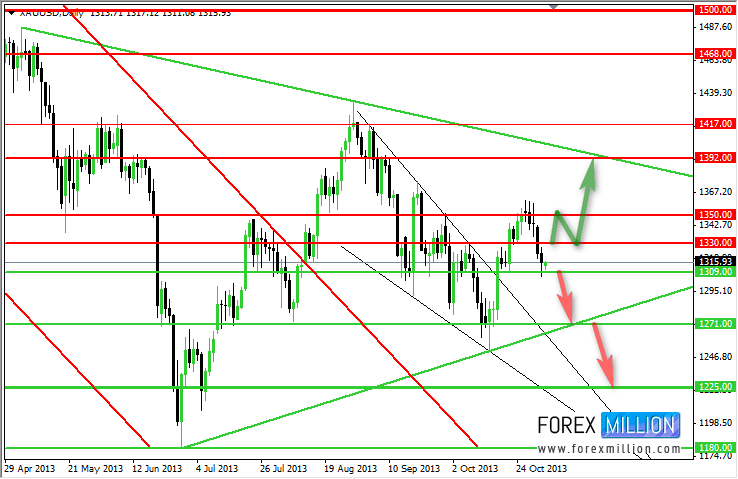 XAU/USD Daily Chart" title="XAU/USD Daily Chart" width="739" height="480">
Previous forecast: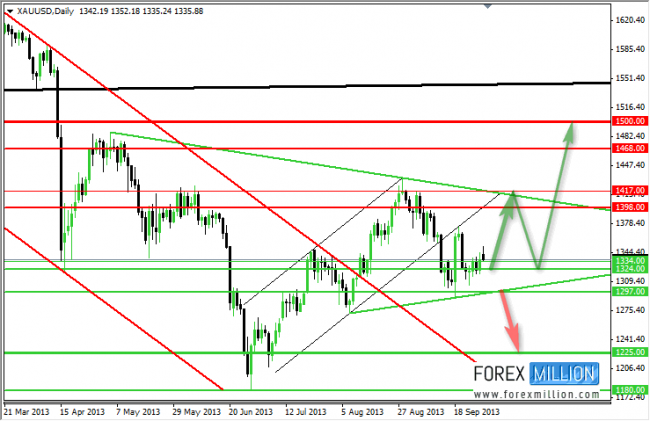 XAU/USD Daily Chart" title="XAU/USD Daily Chart" width="739" height="480">
Long-term Forecast and Analysis, Outlook. October, Novemder, December, January..
Main scenario:
Gold market is trading in 3 wave of uptrend with target on the main resistance level 1500..
Alternative scenario:
A downtrend will start as soon, as the pair drops below support level 1324, which will be followed by moving down to support level 1225.
Support and Resistance levels:
Supports: 1324 (main), 1225 (main)
Resistances: 1398 (intermediate), 1500 (main)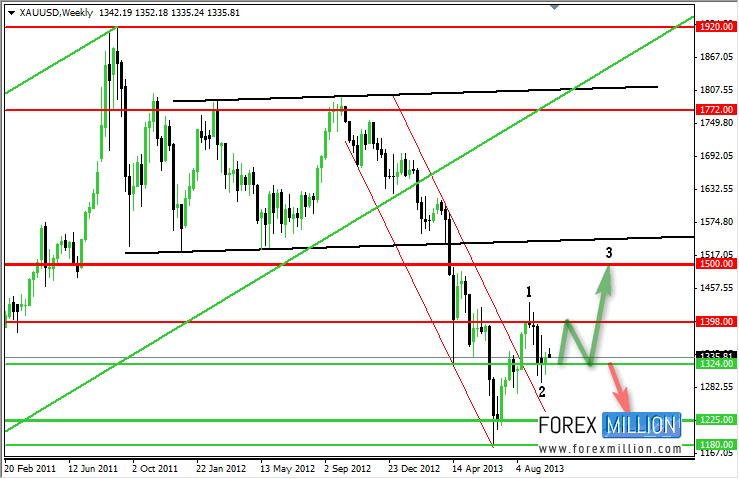 XAU/USD Weekly Chart" title="XAU/USD Weekly Chart" width="739" height="480">