Talking Points
- Crude Oil vulnerable to pullback on build-up in inventories
- Gold range persists as Fed leaves US Dollar uninspired
- Chinese manufacturing reading in focus for copper traders
Crude Oil may give back some of its recent gains if upcoming inventories data reflects a continued supply glut in the US oil market. Meanwhile, Gold and Silver may remain range-bound if the upcoming FOMC Meeting Minutes fail to stir the US Dollar bulls. Finally, Chinese manufacturing data will likely offer some guidance for copper prices as traders continue to weigh the prospect of an economic slowdown in the Asian giant to crimp demand for the commodity.
Inventories Data To Offer Guidance To WTI
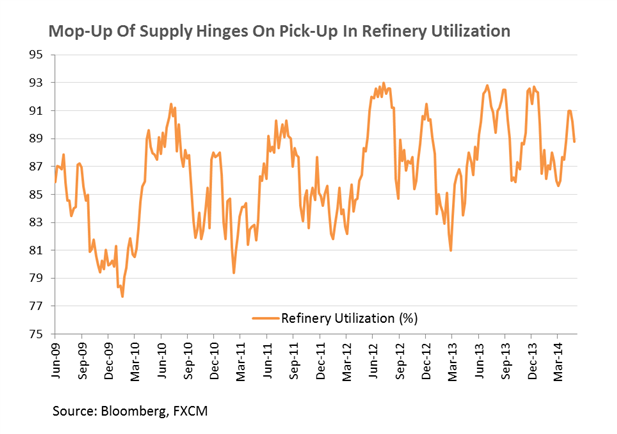
As noted in recent commodities reports one of the underlying themes in the US crude oil market continues to be the apparent abundance in supplies in the Gulf Coast district. Total crude stocks sitting at near-record highs, alongside the highest rate of production for the commodity since 1986 casts a bearish light on WTI.
The upcoming DOE Weekly Petroleum Status Report is tipped to reveal total crude inventories were unchanged for the most recent week according to the median estimate from economists. If we see a rise in total stocks it may reaffirm the bearish supply picture for the commodity and put pressure on WTI prices. Of additional note will be the refinery utilization figure which is tipped to rise by 0.45 per cent. A lower-than-anticipated reading would suggest refineries may be unable to mop up growing supply, which would also be taken as a bearish signal for crude.
Gold Range Persists As Fed Leaves USD Uninspired
A timid stance on potential rate hikes from Fed officials has left the US Dollar to continue its slumber and gold to tread a familiar range over recent weeks. A hawkish lean in the upcoming FOMC April Meeting Minutes may help shift the tides in the greenback’s favor. However, based on recent rhetoric from the central bank the event may prove a lackluster affair, which could leave gold to remain range-bound over the session ahead.
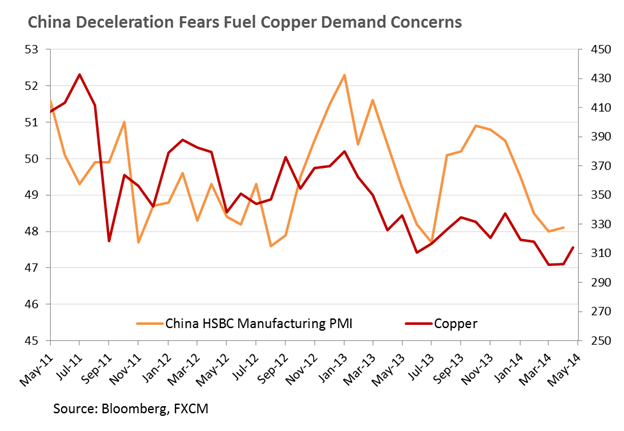
China Growth Concerns May Weigh Copper Prices
The HSBC China Flash PMI figure for May will be in focus for copper traders tomorrow, given the potential for a weaker-than-anticipated reading to weigh on the growth-sensitive commodity. Economists are tipping a reading of 48.3, which would would be a slight improvement over the prior print of 48.1. However, it would also form the 5th consecutive contractionary figure for the key gauge of economic activity in China, which may do little to ease fears over a waning appetite for base metal commodities.
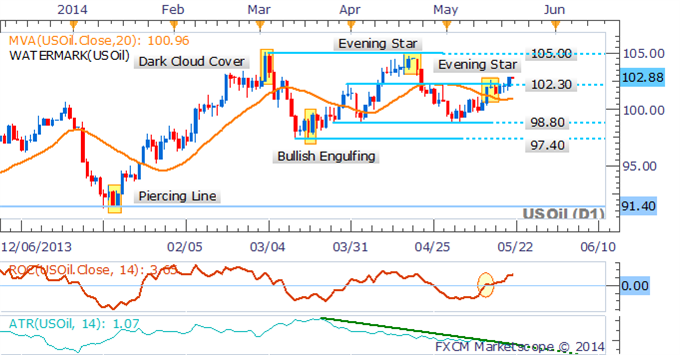
Crude Oil: Break of 102.30 Puts 105.00 On The Cards
WTI has cleared notable resistance at 102.30 as several bullish technical signals suggest a push towards 105.00 may be on the cards. Building upside momentum reflected by the Rate of Change Indicator, as well as prices holding above the 20 SMA suggests the emergence of a short-term uptrend. However, traders should be mindful that the ATR indicates volatility remains low, which generally favors range-trading strategies.
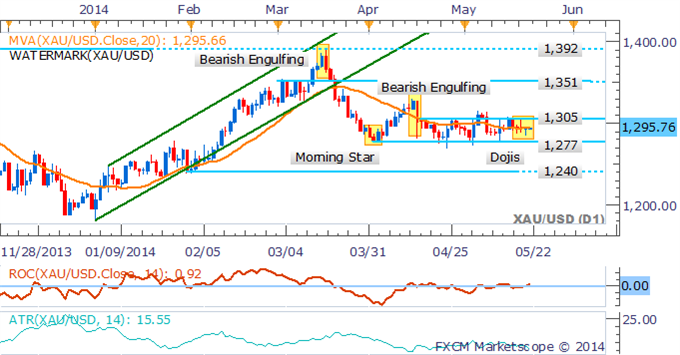
Gold: Dojis Highlight Trader Indecision As Range Persists
Gold continues to drift between $1,277 and $1,305 which may afford short-term range-trading opportunities on either side of the narrow corridor. A lack of momentum signaled by the Rate of Change indicator alongside low volatility levels (reflected by the ATR) and several Doji formations suggest the consolidation may continue.
The DailyFX Speculative Sentiment Index suggests a mixed bias for gold based on trader positioning.
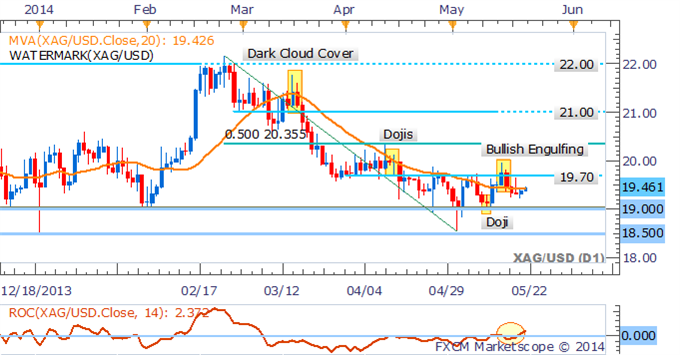
Silver: Eyes The Critical $19.00 Handle
The Bearish Engulfing candlestick pattern on the daily chart for silver is warning of a pullback for the precious metal to critical support at $19.00. A bounce to the resistance zone near $19.70 would be seen as a new opportunity to enter shorts at this stage.
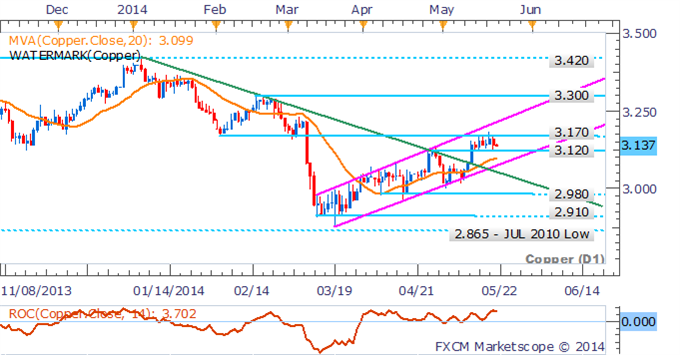
Copper: Bulls Lose Steam Near Resistance
Copper’s recent run higher has stalled with prices becoming compressed between $3.120 and $3.170. At this stage the ascending trend channel remains intact, which affords a bullish technical bias. A break above $3.170 would open up the next notable level of resistance at $3.300.
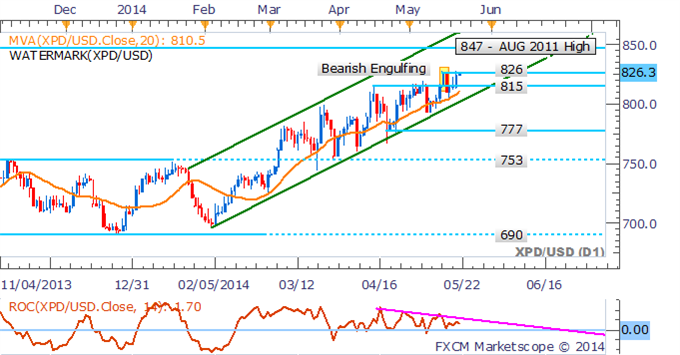
Palladium: Prices Push Off Trendline Support
Palladium has bounced off trendline support as the uptrend for the precious metal remains in force. Clearance of $826 would open up the August 2011 high.
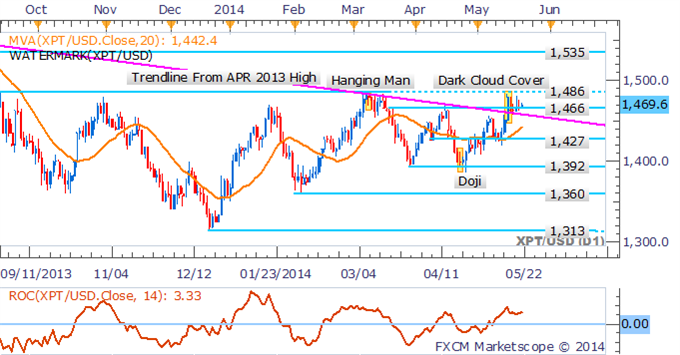
Platinum: At A Critical Juncture Near $1,486
Platinum prices are teasing at a push higher following a retest of the descending on the daily. However, notable selling pressure remains at the $1,486 mark, clearance of the key resistance level would open the September 2013 high at $1,535.
