Gold gained 1% for the week. The stock market wiped out its gains for the year. Funny how freedom confronts the artificiality of financial markets' levels, gold being at half its currency debasement value and the S&P 500 at double its earnings support. "God save the Queen...".
One week ago, gold having printed its highest weekly close (1302) since that ending 15 August 2014, it appeared for all the world that "no Brexit wrecks it", price careening down to as low as 1253 early on in yesterday's (Friday's session) prior to Britons' votes having been tallied, with UK Independence Party leader Nigel Farage even conceding defeat, as 'twas already "priced-in" by the markets and betting parlours 'cross the Isles, (the polls be damned).
But then from the once-StateSide colonies came the spectre of the great Lawrence Peter Berra, his uttering "It ain't over 'til it's over." And as the polls-vindicated referendum results officially hailed Brexit, 'twas the gold shorts over whom gold rolled, price swinging 109 points northward to within 15 of Base Camp 1377, (the session's high coming in at 1362). Thank you Yogi, for 'twas gold's largest grand slam of the millennium-to-date as measured by intra-session points gained from low-to-high for a net "up" day; on a percentage basis, 'twas the millennium's fourth largest intra-session low-to-high move, again for a net "up" day. As the gold dust then settled, price parked itself at 1319, one point above the prior week's high of 1318. Here are the weekly bars from one year ago-to-date:
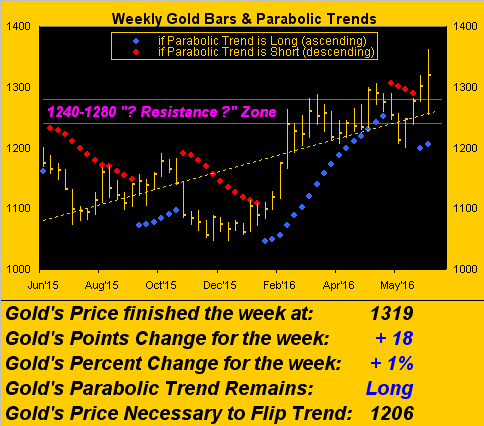
Now: from "The Big IF Dept.", should gold not trade sub-1280 in the new week, we plan to make three technical adjustments:
1) Rename the 1240-1280 resistance zone to the 1280-1240 support zone;
2) Declare that "we now know the bottom is in" (per the 1045 low of last 03 December); and
3) Raise our gold price target for this year from 1280 up to Base Camp 1377
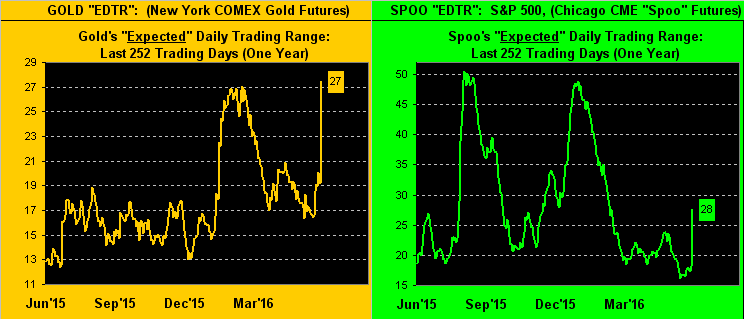
'Tis a Big IF because Gold's EDTR ("expected daily trading range" between price's high and low) has scooted up to 27 points as next shown, the pictures for which are similar across the BEGOS Markets (Bond / Euro / Gold / Oil / S&P); they're all displayed on the website's "Market Ranges" page. In fact, let's pair up gold's EDTR with that for the S&P: 'twould appear the latter's volatility has room to become quite more raucous, what? Again, these panels are charting expected range, not price direction; thus with gold presently at 1319, price could easily re-test/penetrate 1280. Gold's EDTR is on the left and that for the S&P's "Spoo" futures is on the right:
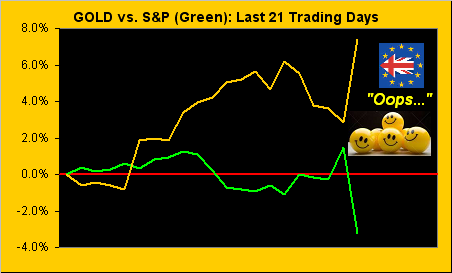
But specific to price direction, as we turn to the percentage tracks of the last 21 trading days (one month), gold and the S&P accelerated their present state of negative correlation yesterday, would you not say?
Next, from our "Keeping One's Feet on the Ground Dept.", we've this information specific to Brexit's implementation. According to a report by the London-based macroeconomic firm Capital Economics, Brexit now having nonetheless won the vote, that "...the UK would probably remain a member of the EU for several years ... The result of the referendum would only be advisory”, the vote alone not being legally binding. Moreover, given the majority of the UK's political leaders desiring to instead stay in the EU suggests the process could well be dragged out to 2020, and the ultimate deal structure -- with the UK no longer in the EU -- quite similar to its still so being. 'Course, if en route we get Frexit, Spexit, Grexit, et Aliexit, one only wonders what to expect.
All that said, this initial episode of EU-purgin' sent all of the BEGOS Markets a-lurchin'. Thus in turning to the 21-day linear regression trends (diagonal lines) of all eight components -- our baby blues dots representative of each trend's consistency -- feast your eyes on the rightmost day (Friday) in each of these 21-day panels:
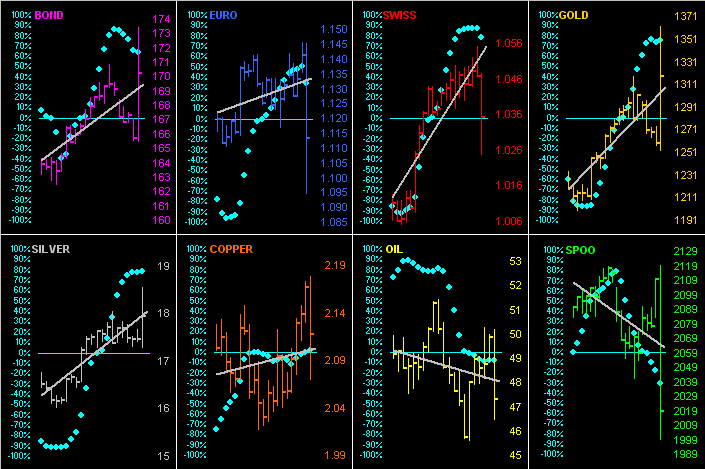
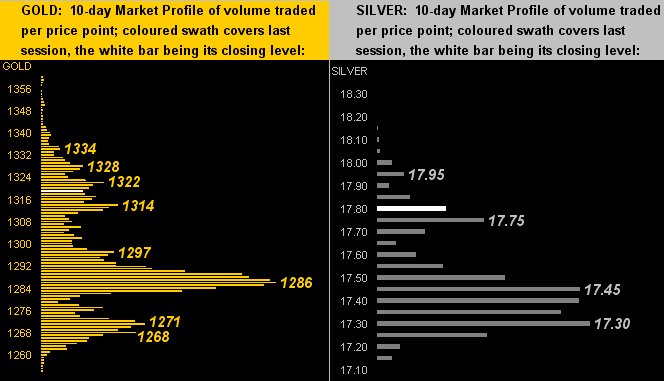
How's that motion sickness workin' our for ya? To be sure, prices' great distances of travel really blew out our 10-day Market Profiles, (again, all of which are at the website). Here they are for both gold (left) and silver (right), as Friday's session engulfed the entirety of their 10-day trading ranges, the white bars being their settles for the week:
Now let's bring in the Federal Reserve Bank and the friendly folk of its Open Market Committee. In my radio interview which aired this morning on The Real Money Show, (and they'll archive it at their website), I was asked if the Fed would raise rates this year. Pointing out that the Economic Barometer had been on the rise of late, I revisited that of which you may have herein read in recent weeks: 'twas a chance for the FOMC to cast off concerns of their "irrelevancy" and become more assertive in pushing up the FedFunds target rate from 0.50% to 0.75%. But again, given the poor payrolls growth for May, the slowing in sales of new homes -- and now with Brexit winning the vote and our StateSide Leading Economic Indicators having just reverted by -0.2% in May -- no, barring the FOMC being ballsy, they shan't raise rates this year. Here's the Econ Baro (blue), along with the S&P (red):
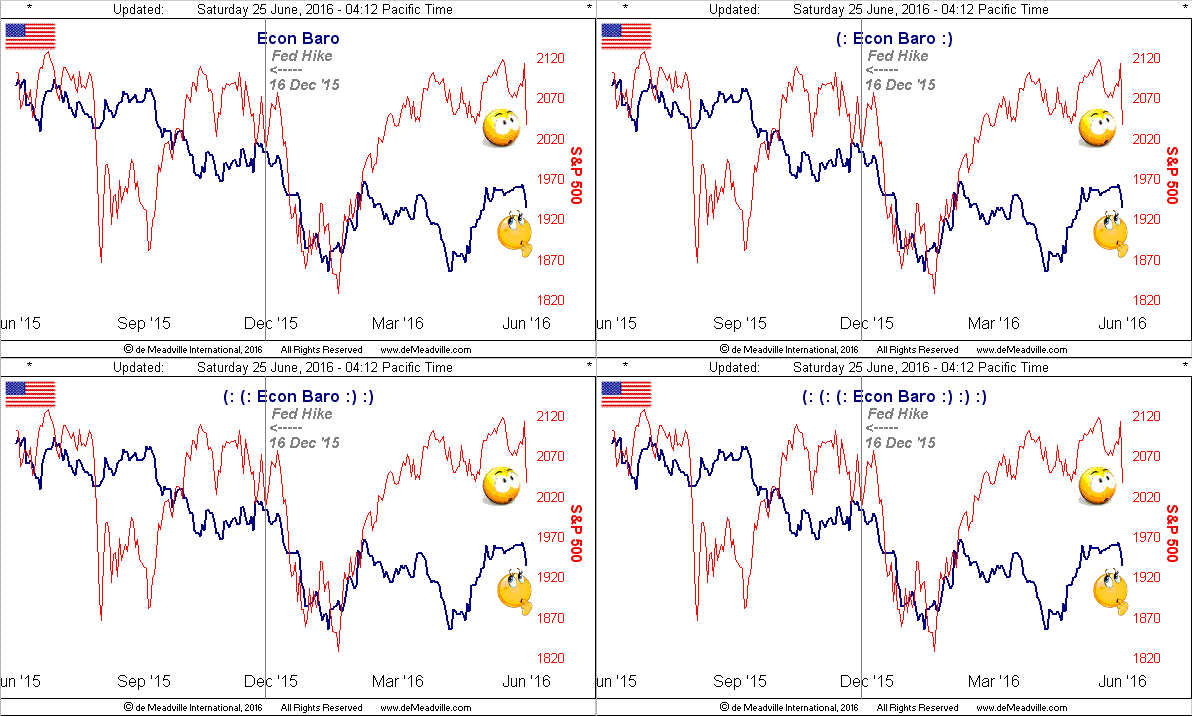
So with both the Baro and S&P kinking down, let's bring up The Gold Stack, "up" being the operative word there as price is no longer dwelling deep down in the stack as has been the case these recent years. Why even this week's high trade for the year at 1362 achieved center-stack status! Here 'tis:
The Gold Stack
Gold's Value per Dollar Debasement, (from our opening "Scoreboard"): 2595
Gold’s All-Time High: 1923 (06 September 2011)
The Gateway to 2000: 1900+
Gold’s All-Time Closing High: 1900 (22 August 2011)
The Final Frontier: 1800-1900
The Northern Front: 1750-1800
On Maneuvers: 1579-1750
The Floor: 1466-1579
Le Sous-sol: Sub-1466
Base Camp: 1377
Year-to-Date High: 1362 (24 June)
10-Session directional range: up to 1362 (from 1253) = +109 points or +9%
Trading Resistance: 1322 / 1328 / 1334
Gold Currently: 1319, (expected daily trading range ("EDTR"): 27 points)
Trading Support: 1314 / 1297 / 1286 / 1271 / 1268
10-Session “volume-weighted” average price magnet: 1293
Neverland: The Whiny 1290s
Resistance Band (becoming support?): up to 1280 (from 1240)
The Weekly Parabolic Price to flip Short: 1206
The 300-Day Moving Average: 1170
Year-to-Date Low: 1061 (04 Jan)
In wrapping it up here for this week, we've these few views:
■ Speaking of stacks, the Paris-based consulting firm Capgemini has issued their 2016 World Wealth Report, which finds that Asian millionaires now rest atop the world's wealth stack, (heaven forbid our monégasque resident friends find out about this), the Asians now having stacked up more wealth than their millionaire buddies in Europe, StateSide and elsewhere 'round the globe. But is that really saying much? From our observations here in tech-laden San Francisco, I'm reminded of these still very salient lyrics we penned-to-song some years back: "Everybody is a millionaire, Everybody drives a Mercedes-Benz, BMWs are everywhere, Yours and mine and all of those of our friends...". We're thus looking forward to the report on bazillionaires.
■ Keeping it local, great news abounds: the unemployment rate here in California just hit a nine-year low: 5.2% percent, according to Sacramentaxus' Employment Development Department. Ah, the Golden Life here "...in that warm California sun..."--(The Rivieras, '64). Why, I was just in the bank this past Monday and the teller told me she had three jobs: one day, one evening and one night. "When do you sleep?", I asked. The perky reply: "I don't; I just nap." What a way to live, eh?
■ And globally, markets don't return immediately to normal ebb and flow following stark, sudden volatility as has just become the case, the Brexit vote nevertheless now in place. Our commodities broker still has intra-day trading margin requirements set to double the norm for the Precious Metals and U.S. indices, and thrice that for currency pairs and European indices. So please, "Don't let the sun catch you crying..."--(Britain's own Gerry and the Pacemakers, also from '64) because your stops get leapt over by many-a-pip. It ain't worth it.
Quite the week 'twas! And in the ensuing one, amongst ongoing volatility and a rash of incoming EconData, we get what is "expected" to be a slowing in the growth of Personal Income/Spending. Hopefully you shan't be slowing your spending on gold. No. Why would you?