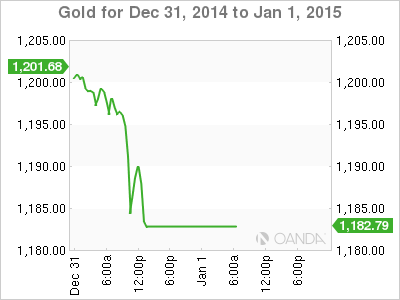
Gold posted losses on Wednesday, closing the day at a spot price of $1183.81 per ounce. US markets are closed on Thursday for the New Year’s holiday, but will resume action tomorrow, highlighted by ISM Manufacturing PMI.
Gold started the year at $1205, just above the key level of $1200. The metal hit a yearly high of $1388 in March, but was unable to stay at this lofty level for very long. In recent months, gold has struggled as the dollar has surged on the currency markets and other commodities such as oil have taken a hit. With the US recovery deepening and the Federal Reserve likely to raise rates in the first half of next year, we could see the metal lose more ground against the greenback in early 2015.
US releases wrapped up 2014 with mixed results. Unemployment Claims surprised with a sharp rise, coming in at 298 thousand, compared with 280 thousand in the previous reading. The estimate stood at 287 thousand. On the housing front, Pending Home Sales bounced back from a decline in the previous reading, posting a gain of 0.8% in December. This beat the forecast of 0.6%. The news was not as good from Chicago PMI, which dropped to 58.3 points, its worst showing since June. The reading fell short of the estimate of 60.2 points.
With the US economy showing better numbers as we head into 2015, the US consumer is showing more optimism about the economy. Earlier in the week, CB Consumer Confidence rose to 92.6 points, up from 88.8 a month earlier. Although this missed the estimate of 94.6, this was a solid reading which follows last week’s UoM Consumer Sentiment report. That indicator has been on an upward swing and hit 93.6 points in December, its highest level since February 2007. Consumer confidence numbers are closely watched, as increased confidence should translate into more spending by consumers, creating more jobs and strengthening economic activity.
XAU/USD for Thursday, January 1, 2015

XAU/USD January 1 at 12:00 GMT
XAU/USD 1183.81 H: 1203.79 L: 1179.64
XAU/USD Technicals
| S3 | S2 | S1 | R1 | R2 | R3 |
| 1130 | 1156 | 1175 | 1200 | 1215 | 1240 |
- XAU/USD posted losses on Wednesday, breaking below support at the 1200 line in the Asian session.
- 1200 is an immediate resistance line. 1215 is next.
- 1175 is a weak support line. 1156 is stronger.
- Current range: 1175 to 1200
Further levels in both directions:
- Below: 1175, 1156, 1130 and 1111
- Above: 1200, 1215, 1240, 1255 and 1275
OANDA’s Open Positions Ratio
XAU/USD has a majority of long positions, indicative of trader bias towards gold breaking above range and moving to higher ground.
XAU/USD Fundamentals
- There are no US releases on Thursday.
Disclaimer: This article is for general information purposes only. It is not investment advice or a solution to buy or sell securities. Opinions are the authors; not necessarily that of OANDA Corporation or any of its affiliates, subsidiaries, officers or directors. Leveraged trading is high risk and not suitable for all. You could lose all of your deposited funds.
