Recently I have been trying to show all the different angles to look at and analyze the US stock market and the precious metals sector. At the end of this report, I will share with you several other crucial angles and charts you must see for our self. There are several very intriguing things unfolding right now which are interconnected in ways you may not have known.
Gold Years and Seasonality
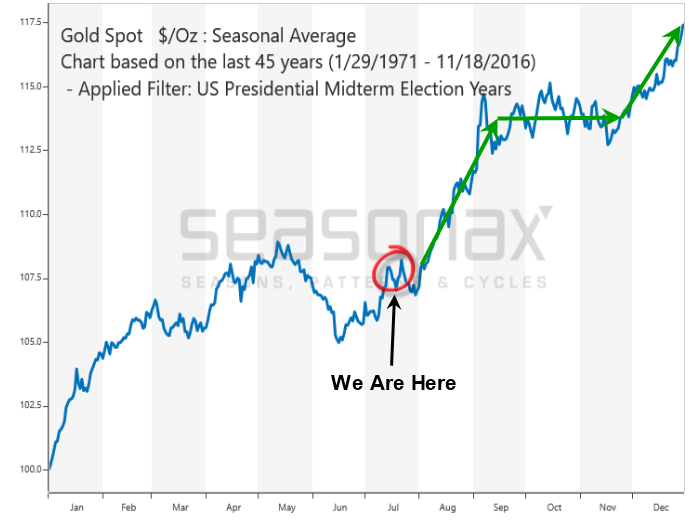
Let’s start off with the price of gold and what it typically does each month during the presidential election year, which is this year 2019. The graph below shows the average price movement during the elections since 1971 and I think the chart speaks for its self.
What I get from this, is that investors become uncertain with the future and accumulate gold.

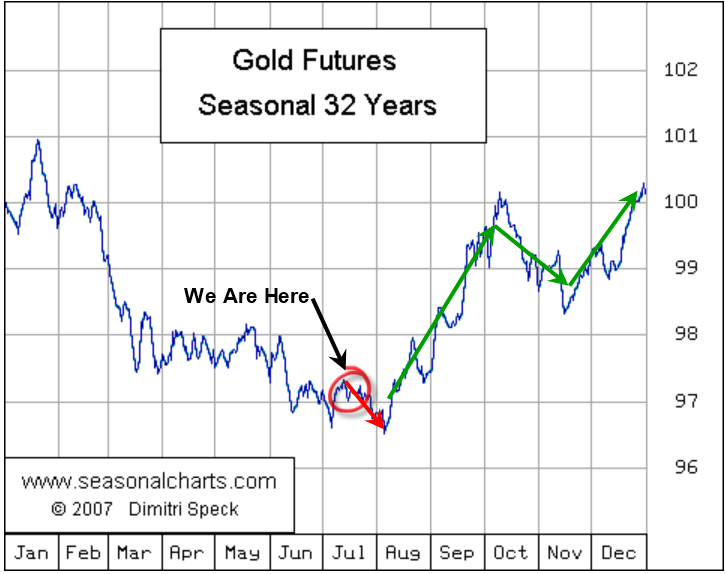
This next chart is the seasonality of gold. Meaning which direction gold trades during each month on average every year. This second chart along with the election chart above both show gold tends to pull back the second half of July, so don’t be alarmed if it happens.

Dow Jones Election Years
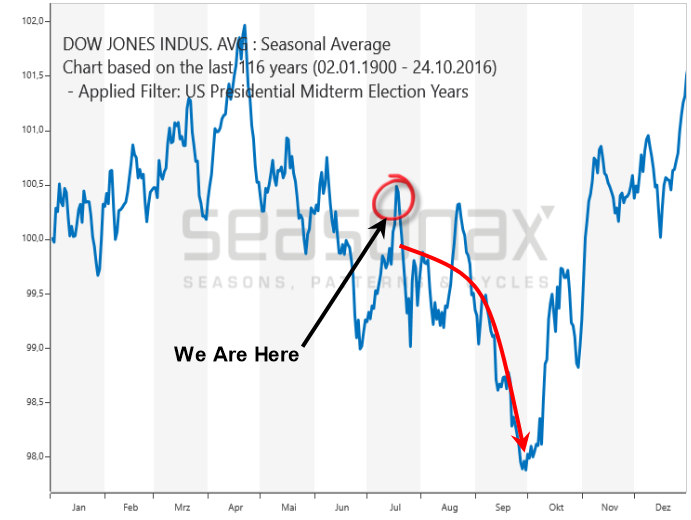
The US stock market in general, but in this case, I’m using the Dow Jones industrial average you can see where stock prices should move during the rest of this year as we go into the November election.

Dow Jones Decade Cycle
As you may or may not know, I have a thing with cycles when it comes to trading. Yes, it seems a little far fetched and can be perceived as Voodoo to some people but statistics don’t lie and I have made an incredible living from the financial markets incorporating cycles in all my trades from long term investing right down to my 30-minute trading charts.
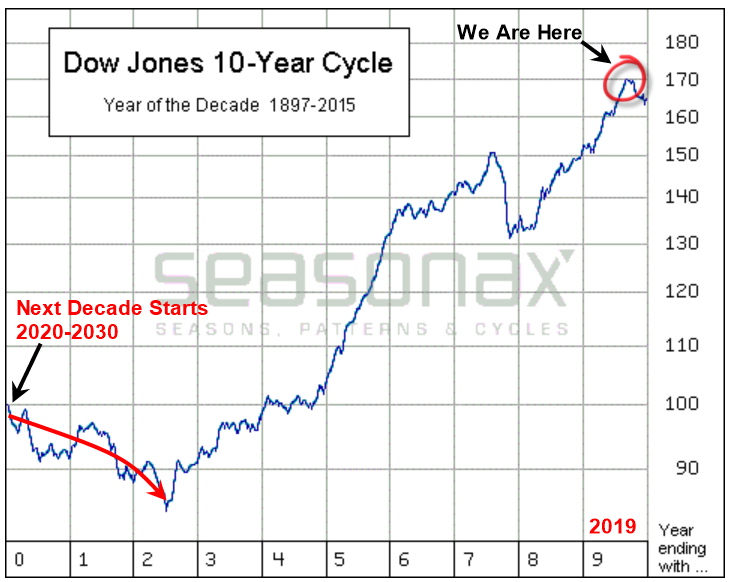
The website SeasonalCharts.com shares this really interesting information and chart about the decade cycle and I want to share it with you here:
“The stock market appears to follow a 10-year cycle. During the first half of the decade, equity prices on average do not increase, however in the second half they clearly do. In addition, U.S. equities have demonstrated very good performance in years ending with the number 5 (e.g. 1995 or 2005). Their average profit amounted to 30 %. That equals 40% of the average profit for the entire decade!
The decade-cycle chart of the Dow Jones shows the average 10-year trend of the index over the last more than 100 years.”

As you can see from those four graphs the odds are pointing towards a market top in the US stock market based on statistics and long-term cycles. And for gold to become the investment of choice and rally the second half of this year.
Below are several other eye-opening charts about gold and US equities. You should take a quick look at each because what I’m sharing in this post and links below is more than enough to know where the markets are headed next. No need to look anywhere else and I think you will agree after you review each section. My analysis is logical, proven, and easy to understand the big picture trends no matter if you are a total newbie to the trading and the financial markets.
Top 5 Important Gold And Stock Market Analysis Posts
In early June I posted a detailed video explaining in showing the bottoming formation and gold and where to spot the breakout level, I also talked about crude oil reaching it upside target after a double bottom, and I called short term top in the SP 500 index. This was one of my premarket videos for members it gives you a good taste of what you can expect each and every morning before the Opening Bell. Watch Video Here.
I then posted a detailed report talking about where the next bull and bear markets are and how to identify them. This report focused mainly on the SP 500 index and the gold miners index. My charts compared the 2008 market top and bear market along with the 2019 market prices today. See Comparison Charts Here.
On June 26th I posted that silver was likely to pause for a week or two before it took another run up on June 26. This played out perfectly as well and silver is now head up to our first key price target of $17. See Silver Price Cycle and Analysis.
More recently on July 16th, I warned that the next financial crisis (bear market) was scary close, possibly just a couple weeks away. The charts I posted will make you really start to worry. See Scary Bear Market Setup Charts.
On June 17th I showed my chart of the transportation index forming a double top formation. It’s known that the transportation index leads the broad stock market and if the transports are breaking down then we must expect the bear market is close. I then went on to talk about the precious metals breakout with silver and silver miners leading the way. Gold miners broke out as well while gold continued to hold its bullish formation. See Transportation index double top.
Concluding Thoughts:
In short, you should now have a firm grasp of where stocks are headed along with precious metals for the next few months and beyond. The next step is knowing when and what to buy and sell as these turning points take place, and this is the hard part. If you want someone to guide you through the next 12-24 months complete with detailed market analysis and trade alerts (entry, targets and exit price levels) join my ETF Trading Newsletter.
In short, the bear market has been a long time coming, but finally, almost all the signs are showing that it’s about to start. As a technical analyst since 1997 having lost a fortune and made fortunes from bull and bear markets I have a good understanding of how to best attack the market during its various stages.
