Join +750K new investors every month who copy stock picks from billionaire's portfoliosSign Up Free

Gold And Oil: Potential Performance Shift

Published 05/29/2014, 01:34 PM
Updated 07/09/2023, 06:31 AM
GC
-
CL
-
GLD
-

Gold has been a disaster lately, with the past few days seeing some large selling take over in this shiny metal market. I wrote about gold hitting resistance the day after the SPDR Gold Trust (ARCA:GLD) peaked back in March and more recently I highlighted the triangle pattern that was forming on the daily gold chart with momentum hitting previous resistance. So where does gold stand now?

With the recent increase in weakness for gold, I wanted to show one bright spot that may be developing, at least compared to oil. Below is a chart of the relative performance between gold and Crude Oil. As a reminder, when the green line is rising we know that gold is outperforming oil. That could mean gold is rising more or gold is falling less than oilit doesn’t mean gold prices will start rising – this is just looking at the ratio between the two commodities.

The ratio right now is testing previous support going back to 2013. In late December and in August and September of last year we saw the ratio between gold and crude oil bottom around the 12.2 level. We also can see that the Relative Strength Index (RSI) as shown in the bottom panel just kissed the ‘oversold’ 30 level. Back in August ’13 we saw the RSI spend some time under 30 before seeing a shift in relative performance. However, if we go back further we can see that sometimes we just see a day or two of being ‘oversold’ in momentum before a trend change occurs in the ratio.

So with the relative performance ratio between gold and oil testing support and momentum being nearly ‘oversold’ its possible we see a shift in relative performance to begin favoring gold. We’ll see.

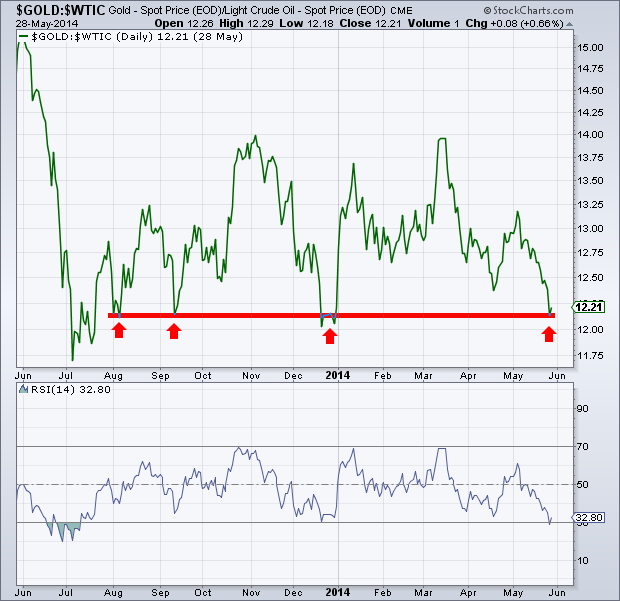
Gold vs. Light Crude

Latest comments

Loading next article…
Risk Disclosure: Trading in financial instruments and/or cryptocurrencies involves high risks including the risk of losing some, or all, of your investment amount, and may not be suitable for all investors. Prices of cryptocurrencies are extremely volatile and may be affected by external factors such as financial, regulatory or political events. Trading on margin increases the financial risks.
Before deciding to trade in financial instrument or cryptocurrencies you should be fully informed of the risks and costs associated with trading the financial markets, carefully consider your investment objectives, level of experience, and risk appetite, and seek professional advice where needed.
Fusion Media would like to remind you that the data contained in this website is not necessarily real-time nor accurate. The data and prices on the website are not necessarily provided by any market or exchange, but may be provided by market makers, and so prices may not be accurate and may differ from the actual price at any given market, meaning prices are indicative and not appropriate for trading purposes. Fusion Media and any provider of the data contained in this website will not accept liability for any loss or damage as a result of your trading, or your reliance on the information contained within this website.
It is prohibited to use, store, reproduce, display, modify, transmit or distribute the data contained in this website without the explicit prior written permission of Fusion Media and/or the data provider. All intellectual property rights are reserved by the providers and/or the exchange providing the data contained in this website.
Fusion Media may be compensated by the advertisers that appear on the website, based on your interaction with the advertisements or advertisers.
© 2007-2024 - Fusion Media Limited. All Rights Reserved.