The yellow metal is one of the oldest yardsticks when it comes to measuring price against different financial instruments. Here we will look at the three most important Gold ratios that could shape the next trajectory of the metal in the not too distant future.
Gold/Silver Ratio
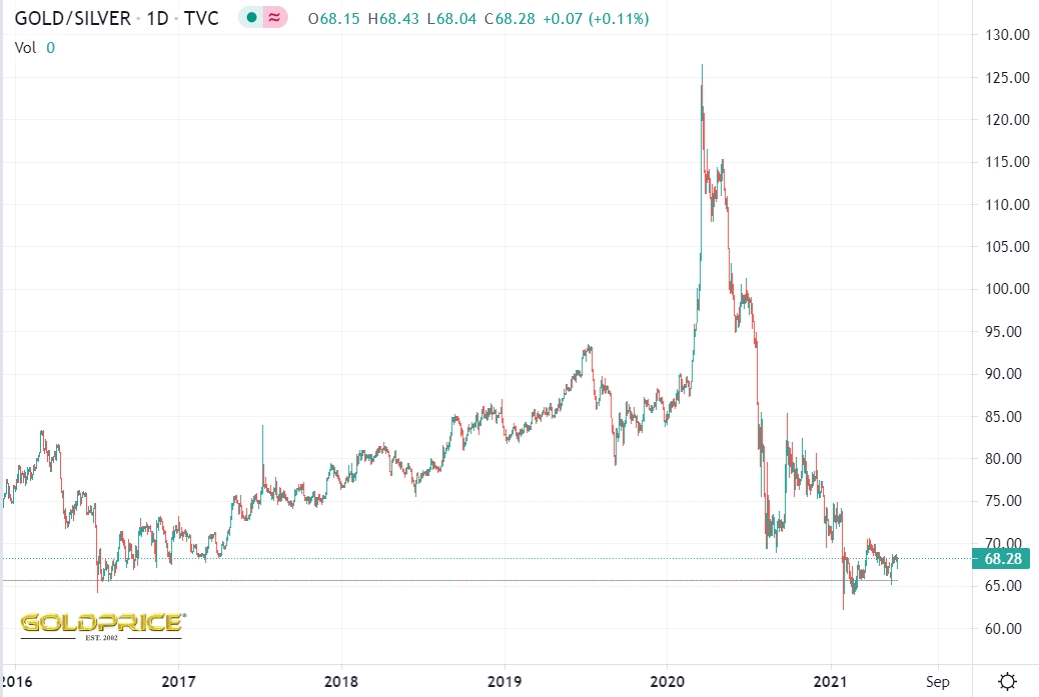
The best known and the most traded of all the gold comparisons is the gold/silver ratio. Gold is mined out the ground at a ratio of 1:8 against Silver. We must also remember that silver only has around 30-35% mined direct, with the remainder being a by-product. As you can see from the chart below, the current gold/silver ratio stands at around 68:1. The lowest this ratio has been was in 1980 when it hit 1:15, with the highest recorded last year in the Covid crash spiking briefly above 125:1. The median over the 20th century was 47:1, so even at today’s levels, silver looks comparatively cheap given gold is some $180 off all time highs, and Silver sitting some 40% below its highest recorded close. Given the fundamentals for both metals, I suspect this ratio will close up as Silver has always accelerated higher at a faster pace than Gold in a bull market. 
Gold/Dow Ratio
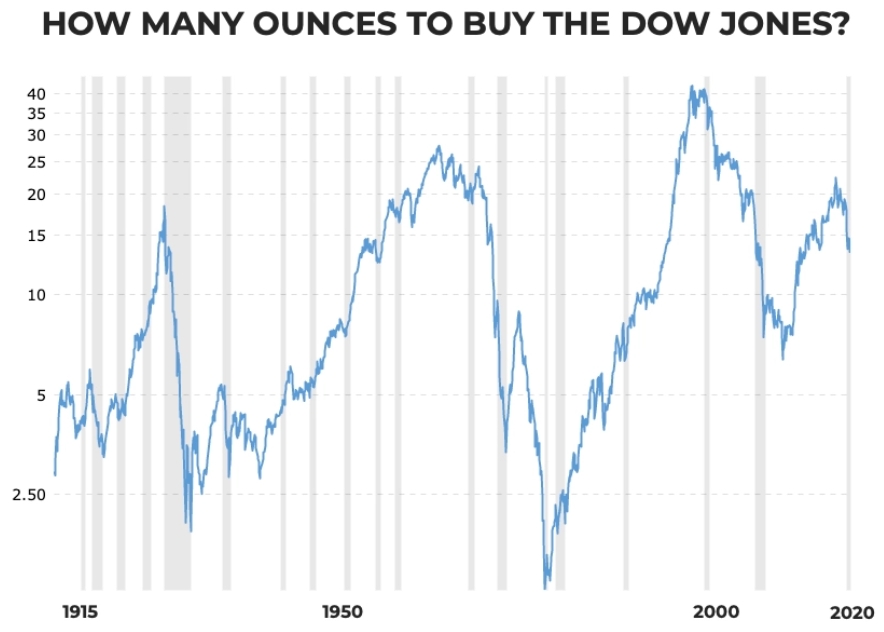
The sometimes forgotten benchmark of how many ounces of gold buys you the Dow index. This has been used for a years, and is a good yardstick when comparing two entities that are used as a barometer of the economy sometimes in an inversely proportional way. When times are good and the economy is thriving the Dow is attractive and there is little incentive to own gold. Conversely in times like we experience now, gold is a more attractive asset to own, with the Dow looking extremely overvalued. As the chart shows below, in 2020 we were just under 15 ounces of gold to buy the Dow. At the time of writing that figure stands at just over 18 ounces.
Pierre Lassonde, the billionaire businessman, recently claimed he believed this ratio would go to 1:1. His thesis being a $25,000 gold price with the Dow dropping some 10,000 points to the same level. While the Dow can drop, can gold get that high? It is certainly a bold claim and absent some catastrophic event I’m afraid that seems a bit outlandish……or does it? We’ve heard slingshot high price predictions for gold for years for some analysts, and today is no different. Many names are predicting Gold at over $10,000 an ounce in the next few years, but why? That brings us on to the next subtitle.
Gold/Debt Ratio
This is by far the most relevant as we stand today in my opinion. If we look at the world debt at over 300% of GDP, and the historic ratio of gold to debt it paints a quite scary picture. If we take the metrics of silver and the Dow above, they can fluctuate and change the ratio dramatically in just a few days. March 2020 we saw wild swings. The gold to debt ratio however doesn’t have the same variables. Whilst the price of gold can move fairly quickly, the situation we find ourselves in with world debt cannot change overnight. It actually is worsening – considerably – by the day. The gold to debt ratio historically has sat between 20-40% of world debt. Using the lower level that puts gold at $6,000/oz and at the higher end would put it at $12,000/oz. Scary? Yes. Possible? Absolutely. Likely? Perhaps, especially if the world plan is to use the price of gold to pay off this debt. This would put a completely different dynamic on how Gold is valued. With the debt crisis worsening, has anyone got any better ideas?
