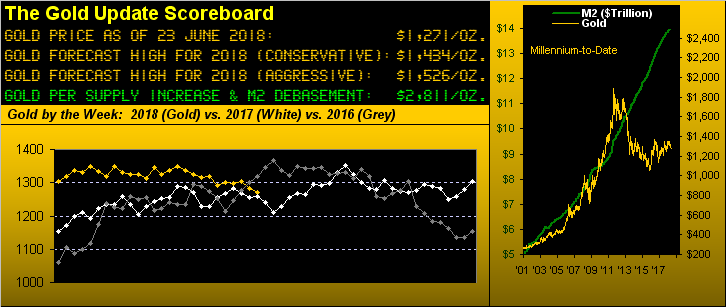
From the "Just Mail It In Dept." the following thought (not for the first time) did cross our mind: take the piece penned this past 11 November, change its date to today and post it. After all, 'twas aptly titled "Again We Find Gold Again Boxed-In Again". For with price settling the week yesterday (Friday) at 1271, en route making fresh lows for the year, we've Gold's first weekly close back in The Box (1280-1240) since 22 December.
Eight years ago to the day (22 June 2010), Gold's price settled above 1240 for the very first time. 14% of the trading days since then (287/2016) have found Gold settling inside of what we today refer to (ad nausea) as The Box (1280-1240). Indeed, if we view The Box as a single round number, Gold today is an "inch" from where 'twas those eight years ago. And yet the ever-debasing StateSide money supply as measured by M2 has since risen from $8.61 trillion to $14.12 trillion. What are we missing?
"Well obviously a doubling in the price of Gold, mmb..."
Understatedly so, Squire, especially given our "national debt" level of $21 trillion exceeds the country's M2 liquidity by nearly 50%. Does this mean the dear old USA shall have to eventually succumb to an estate sale? "Tell the French they can have Louisiana back for its GDP of $216 billion, plus an option on the otherwise seceding Principality of San Francisco." You think Gold's got problems...
Nonetheless, now well into our ninth year of writing The Gold Update, one wonders -- had we the foresight that since 2014 the yellow metal would be on a road to nowhere -- if we'd have kept at it. Hindsight being 20/20, we have and shall continue to so do, albeit many might find putting the rouge on the sedentary porker week-in and week-out to be a chore such as to give up and move onto the next event. Not us, but 'tis been an ornery ride across many-a-month from 2014-to-date:

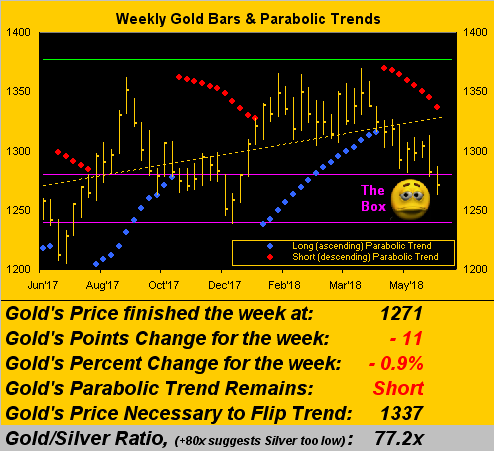
As for Gold's weekly bars from a year ago-to-date, the descending red dots of Parabolic Short trend are now eight weeks in length, The Box by its purple boundaries being thoroughly put to the supportive test. Should 1240 fall away, we'll likely have to call away our forecast 1434 high for this year, The Box then technically morphing from support into resistance. Stay tuned:
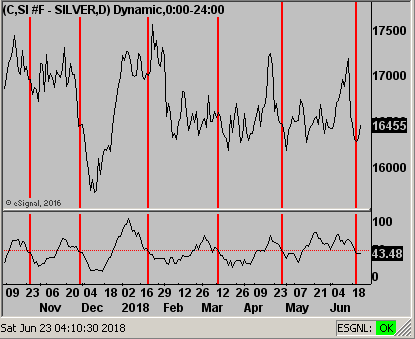
Now with respect to Silver's "hard knocks", you may have read at in the website commentary of a confirmed Market Rhythm Target for price (having settled the week at 16.455) to break down below the year's low (16.070) to 15.890, (or 15.960 per the September contract into which we roll this next week). This is because Silver's daily "Moneyflow" study (per the lower panel in this next graphic) crossed below its horizontal line placed at 48 (scale 100-to-0). As the vertical red lines indicate, similar downside crossings generally beget lower prices; the 15.890 target simply is typical of the downside distance achieved from prior like signals. (As is with all that we write, this is merely a technical observation and per our Disclaimer is not advice nor a recommendation). Indeed as we're a big fan of Sister Silver, it'd be nice if we're wrong and Silver instead firms and rises:
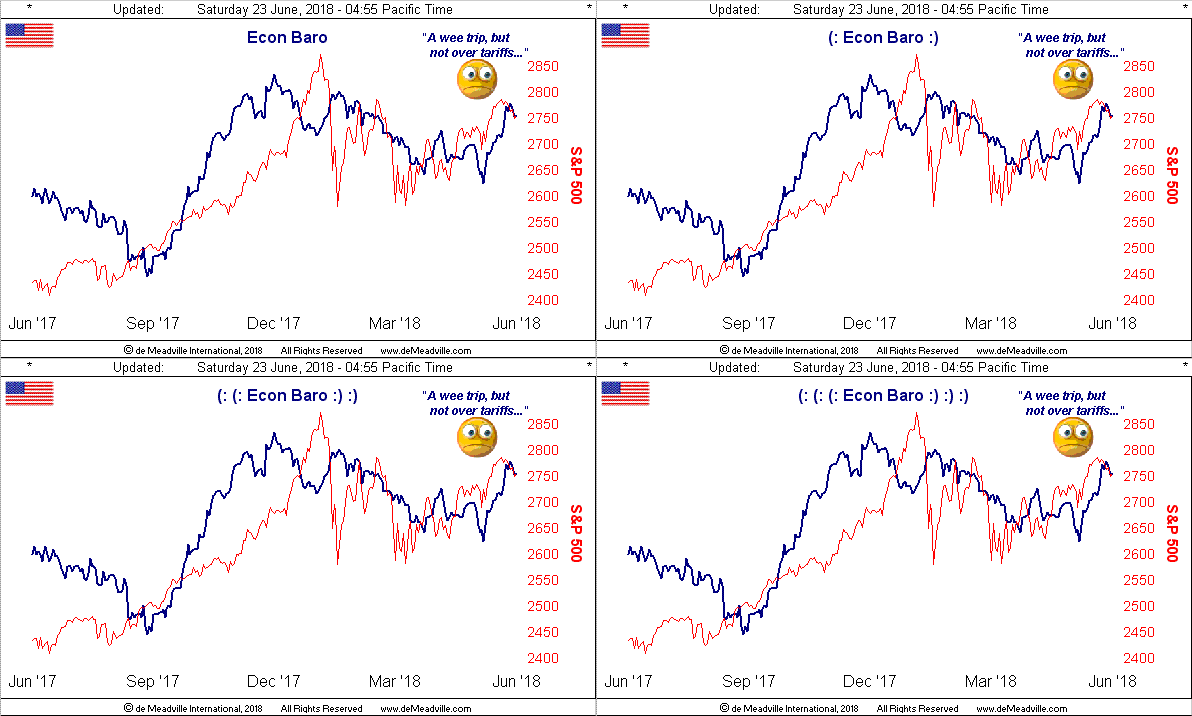
Far from wrong these days is the StateSide economy, barring its later getting tripped up by tariffs. Still, the Economic Barometer did record some stumbling metrics this past week: The National Association of Home Builders Housing Market Index took a bit of a whack in falling from May's read of 70 to 68 for June; more severely whacked was the Philadelphia Fed Manufacturing Index, dumping from 34.4 in May to June's 19.9 reading; and then came the halving whack of our favorite lagging indicator -- The Conference Board's Leading Economic Index -- its May growth reduced to 0.2% from 0.4% in April ... but then you already anticipated that given the Baro's decline during that time:
As for the past two weeks, what's really been in decline are all three of the BEGOS Markets' metals with Gold -2.5%, Silver -2.2% and Copper (not a typo) -8.3%; lower too are both the S&P 500 -0.9% and the Euro -0.4%; 'course with Oil +5.7% for the two weeks, the Bond +0.7% and the Swiss Franc +0.3%, one would think Gold too ought be higher. But when the financial world continues along as screwy-louie as 'tis in dealing with higher interest rates, tariff-driven fates, and a dollar +0.7% across the same dates, traditional relationships take on their own traits.
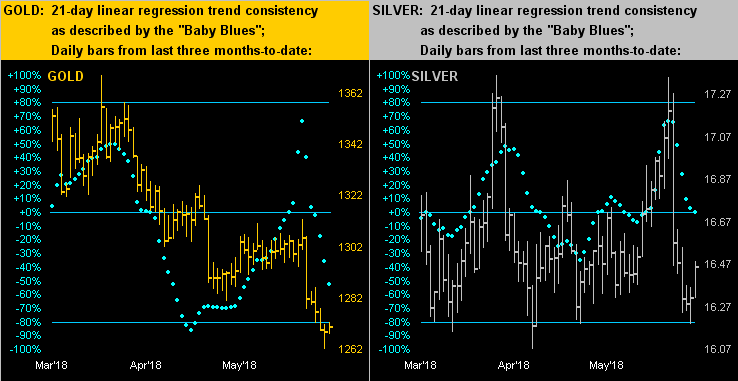
So in calling it straight, it ain't lookin' so great for the precious metals as we next turn to their last three months-to-date of daily bars for Gold on the left and Silver on the right. Gold's baby blue dots of linear regression trend consistency continue their "Kerplooey!" from a week ago, whilst those for Silver are poised to break below their own 0% axis: again if the aforementioned Moneyflow study plays out to form, Sister Silver ought soon see the high 15s:
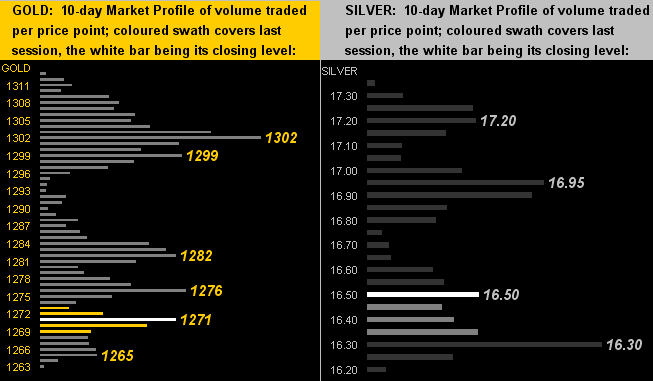
Thus as we drill down into the 10-day Market Profiles, let's stay with Silver (below right) wherein her saving supportive grace is depicted at 16.30; as for Gold (below left) the present 1271 level is the fourth-most actively-traded price through the past fortnight. But more importantly, Gold's overall critical support area it need hold is The Box (1280-1240), else we fear the year is lost:
Now for these few exit notes:
■ The once-venerable (now rather worn out) Reuters ran with this bit into Friday: "Stocks set for worst week in three months on trade war worries"; we wryly smile when we read these direly-coated headlines when considering up with which they'll have to come upon the stock market putting in its full 25% correction (down to S&P 2154).
■ A favourite quip of ours is: "World Ends, Dow +2". And one might opine with General Electric (NYSE:GE) -- the mightiest and longest-lasting charter member of the world's most vaunted stock index -- departing the Dow come Tuesday that 'tis in a sense "the end of the world". And yet we presently see "Dow +119".
■ Finally from our "No Kidding? Dept.", the Basel-based Bank for International Settlements has weighed in that "Cryptocurrencies are not scalable and are more likely to suffer a breakdown in trust and efficiency the greater the number of people using them". We'll be banging about beautiful Switzerland later this fall and perhaps a stop by the BIS to give 'em an "Atta-Boy!" is warranted. Common sense wins every time 'tis tried. (P.S. Got Gold?)