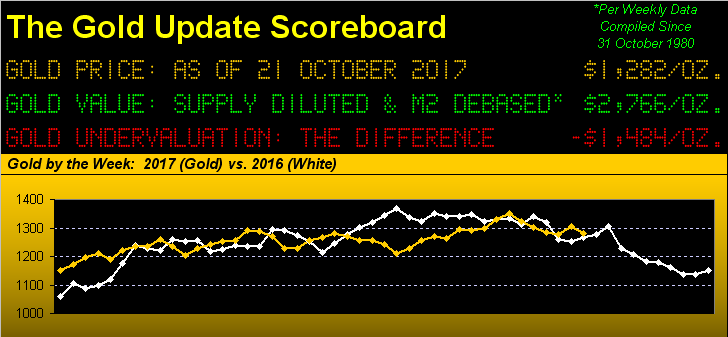
In wrapping up last week's missive we simply wrote: "As to what we see for Gold in the new week: not much."
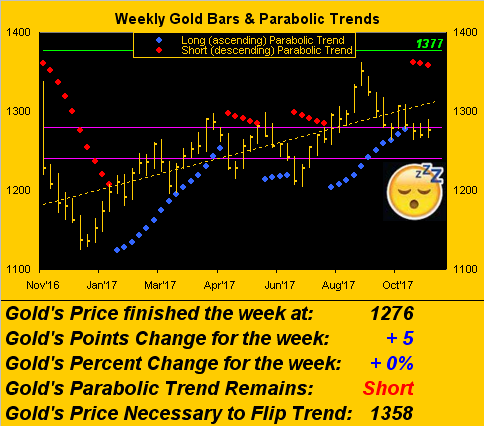
What did we get? Not much. Not that a net change for the week of 0% is nothing, given Gold's having to endure a micro-crash yesterday (Friday) before settling out the week at 1276. 'Twas the third consecutive week of Gold sporting a net change of less than 10 points. And over the last six weeks, which included a 27-point net gain that was then immediately mitigated by a 24-point net loss, one might stretch to say there's been no net change whatsoever. So for the 18th of the 45 trading weeks year-to-date, again we find Gold having again finished inside of The Box (1280-1240) again.
Miss Gibbs? "Yes, sir?" Might you select any one of our recent articles, simply change its date to today, and post it? Doubtful anyone would be the wiser. "But you ought comment on the micro-crash." Yes, Miss Gibbs. (She's a winner).
And so here we go with nine minutes on Friday in the life of the COMEX December Gold futures contract. A 10-point drop in Gold is not that remarkable, but when it swiftly evolves on seven-times the usual volume for that time of day, one cannot help but wonder what may be afoot:
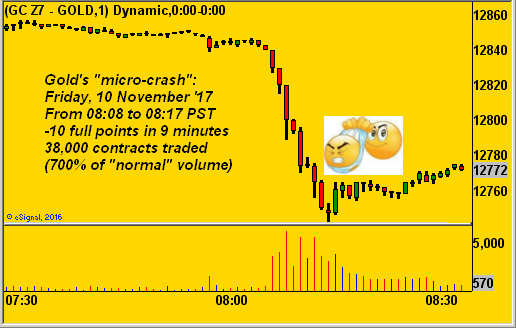
Now consider this: to trade 38,000 contracts requires "day margin" in an entity's account of nearly $60 million, (and if held "overnight", some $205 million). Such an account size surpasses even that of Squire's.
"Don't look at me, mmb..."
Now just stay with me, Squire. As each Gold contract "controls" 100 ounces, 'twas essentially a sale approaching some 4,000,000 ounces, i.e. around $5 billion worth. That's a "hedgie-wedgie", and if for no other reason than window-dressing, 'twas deliberately Gold depressing. Still, back in crept the buyers, giving credibility to the supportive stance of The Box (1280-1240) as bordered by the purple lines in our below chart of Gold's weekly bars from a year ago-to-date, the parabolic Short trend now three weeks in duration:
That noted, from our "Out of Sorts Dept." we've this comparative glance across the past 21 trading days (one month) of Gold's percentage track: at best 'tis skating along rather erratically as if having taken a puck to the privates, but nonetheless determined to stay in the game. But note the quite positive correlation between the Dollar and the stock market as measured by the S&P 500: back in the "old school" days when earnings used to have meaning, 'twas was a stock market negative to have a strengthening Dollar, given its adverse impact on converting income from abroad. Today, profitability matters not as reflected by the market's still rising in spite of a rather poor Q3 Earnings Season: of the 429 S&P 500 companies having reported, only 180 (42%) have bettered their bottom lines from Q3 a year ago. 'Course, all of this has placed the Bond in an utter state of directional confusion. Here's the picture:
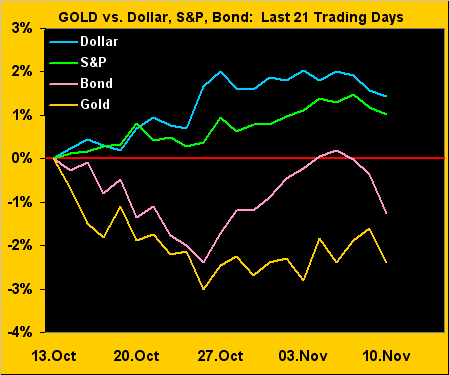
One might suggest that glaringly missing from the above chart is Oil's performance, its 9.5% increase in price these past 21 days (thanks in part perhaps to Saudi princes' et alia purgings) would compress the tracks of the other markets in the graphic. But we're watching for the West Texas Intermediate price (presently 56.90) to technically run out of puff as it did in the Spring of 2015 in the low 60s area. (Mind the chart of Oil's "Baby Blues" for clues at the website).
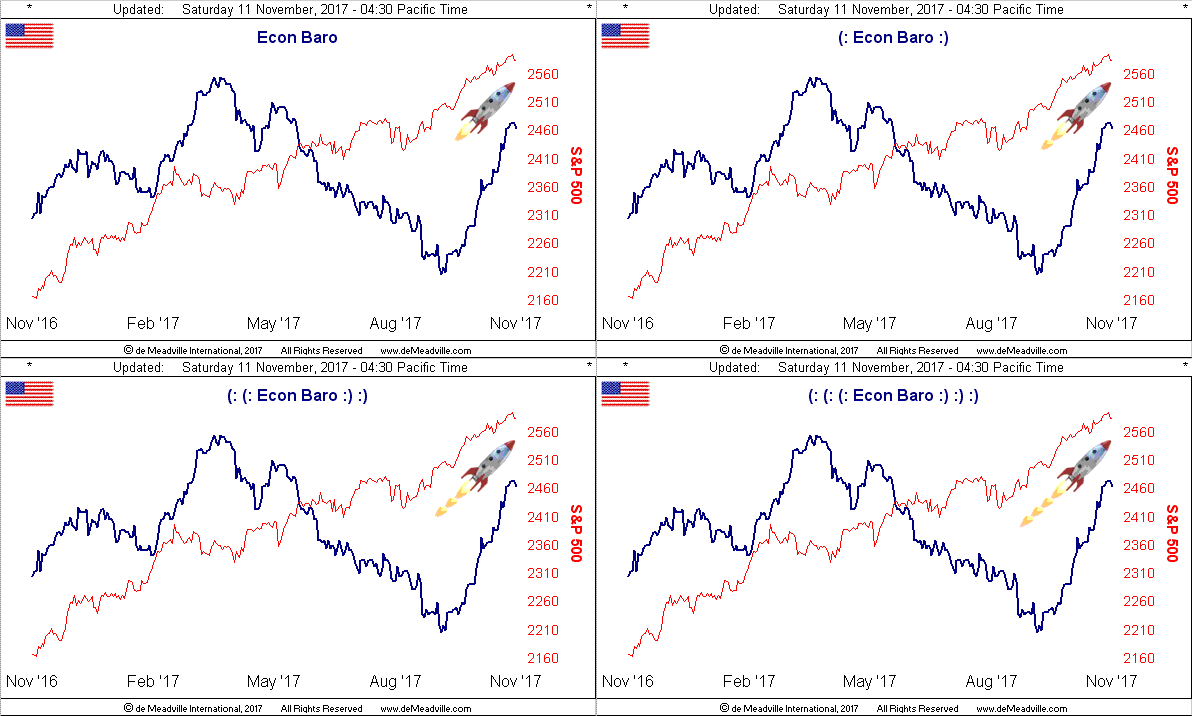
Now having noted a week ago the brilliant move by the Bank of England in raising their Official Bank Rate as the economic outlook for the United Kingdom dims, the opposite seems the case across the channel with EuroZone expansion expectations being again ramped up, this time to 2.2% toward a ten-year best. Possibly the rocketing pitch of the StateSide economy is passing across the pond? Here's our Economic Barometer for the past year along with the S&P (red line):
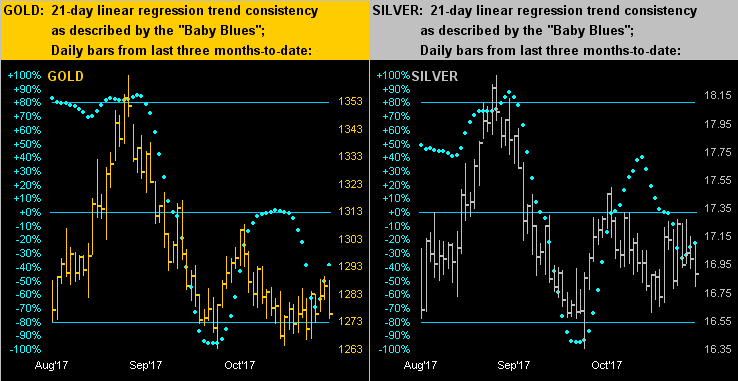
From rocketing to languishing we next go in viewing the performance of the precious metals from three months ago-to-date. Across the panel for Gold on the left and Silver on the right we've the baby blue dots of 21-day linear regression trend consistency, which during the past week have curtailed their respective declines as Gold notably strives for support within The Box (1280-1240). That said, until the "Baby Blues" return above their 0% axes, the 21-day trends remain down:
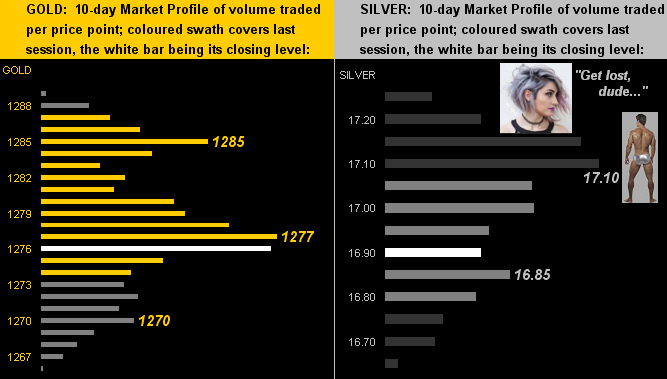
As for overhead trading resistance to be overcome, here we've the 10-day Market Profiles. For Gold (left), 1277 remains the most dominantly-traded price for the past two weeks, whilst for Silver (right), the dominator is 17.10 ... a level lucky even to be on the screen: for given the average Gold/Silver ratio millennium-to-date is 62.7x vs. the current ratio's being 75.6x, lowering the denominator to said average puts price up to 20.34. Or as a message to the shorts out there, do not mess with Sister Silver:
Toward the wrap, here's the Gold Stack:
The Gold Stack
Gold's Value per Dollar Debasement, (from our opening "Scoreboard"): 2763
Gold’s All-Time High: 1923 (06 September 2011)
The Gateway to 2000: 1900+
Gold’s All-Time Closing High: 1900 (22 August 2011)
The Final Frontier: 1800-1900
The Northern Front: 1750-1800
On Maneuvers: 1579-1750
The Floor: 1466-1579
Le Sous-sol: Sub-1466
Base Camp: 1377
2017's High: 1362 (08 September)
The Weekly Parabolic Price to flip Long: 1358
Neverland: The Whiny 1290s
10-Session directional range: up to 1290 (from 1266) = +24 points or +2%
The Box: 1280-1240
10-Session “volume-weighted” average price magnet: 1278
Trading Resistance: 1277 / 1285
Gold Currently: 1276, (expected daily trading range ["EDTR"]: 13 points)
Trading Support: 1270
The 300-Day Moving Average: 1254 and falling
2017's Low: 1147 (03 January)
In closing, we've these few notes:
■ Since our Labor Day (04 September), there have been 49 trading days: only on three occasions therein has the S&P 500 fallen on two consecutive days, the most recent pair being this past Thursday and Friday for a combined two-day net loss of 12 points (-0.47%). Oh the panic! Oh the punch in the gut! Oh the not understanding of what's what! And yet Bank of America Merrill Lynch cautioned its clients that "The recent pullback is a 'dress rehearsal' not the Big One" Is that an inference therefore that this decline was not the stock market crash? Oh NO!!!
■ Keeping your precious bitcoin secure in that cryptocurrency wallet in your hip pocket? We hope so. Especially now that a bunch of code conveniently "vanished" this past week to the tune of $280 million in something called "ethereum". Cue that 1974 track by Yes entitled "The Gates of Delirium".
■ Willing to put up paying 70% more for your pot? Here in California, that's the expected percentage pop upon recreational sales and new taxes kicking in come 2018. "Awww, hey, man! Does that also apply to my Maui Waui? And what about my Acapulco Gold?"
■ And then of course there's the once great StateSide tax bill purportedly goin' bad. AGAIN: you are hanging onto your REAL Gold, yes?