
Central Banks Dominate The Market
The FOMC meeting went as expected – a further reduction in its monthly bond purchases of USD 10bn and no significant changes in the statement or its forward guidance -- and had almost no impact on trading. The Fed said that underlying strength in the economy was improving and the risks to future activity had become more balanced. We’ll learn more about this later in the day, when the US announces the flash estimate of Q4 GDP. It’s expected to show an annualized rise of 3.2%, a deceleration from +4.1% in Q3. Private-sector demand is expected to be healthy, led by strong consumer spending and a pickup in exports, but this will be partly offset by a drop in federal spending because of the government shutdown. Investors may therefore look through the decline in the headline when assessing the data and focus on the details. Strong private sector demand could support USD even if the headline figure shows a slowdown in growth. On the other hand, the personal consumption core price index, the Fed’s favorite inflation measure, is forecast to slow to +1.1% qoq SAAR from +1.4%. Inflation this far below the Fed’s 2% target could start to make some FOMC members nervous about withdrawing too much stimulus, but so far this is largely a theoretical concern in the US.
The Reserve Bank of New Zealand (RBNZ) also kept its interest rates unchanged, but that pushed the NZD lower as the market had been pricing in about an even chance that they would hike at this meeting. Furthermore, the end of the statement merely said that the RBNZ “remains committed” to hiking rates as needed and that the pace of increase “will depend on future economic indicators.” The lack of any hint of a hike at the March meeting disappointed some investors. I think a hike is likely, or at least the possibility of a hike is likely – more than can be said for many markets – and recommend investors consider buying NZD on dips.
In this context, I remain bearish on AUD/NZD following this morning’s downward revision in the final HSBC/Markit China manufacturing PMI for January, the first sub-50 reading in seven months. Some economists are already marking down their forecasts for China’s Q1 GDP in response to the lower PMI. It appears to me that the AUD is more vulnerable to a slowdown in China than NZD is and so NZD should continue to gain on AUD. The next clue will be on Saturday, when the official Chinese manufacturing PMI for January will be announced. Although it’s forecast to remain in expansionary territory, nonetheless it’s also expected to fall to a seven-month low. That might provide another downward push to AUD.
EM turmoil the main story The main story though was not in the G10 currencies, but rather in the emerging market (EM) world. EM currencies continued to sell off despite – or perhaps due to? – the South African Reserve Bank’s (SARB) surprise 50 bps rate hike yesterday. In fact the ZAR was far and away the worst-performing currency overnight, falling 3.1% vs USD. But many other EM currencies saw large declines as well: HUF was down over 2%, MXN -1.7%, and PLN and INR off 1%. The SARB rate hike demonstrates the poor trade-offs that EM countries face with the Fed tapering: either let their currencies go and face higher inflation/lower purchasing power, or raise rates and stifle growth. With funds just starting to flee EM stocks markets (see graph), this crisis is just beginning, in my view. It has further to go and these currencies have further to fall.
EM to boost JPY, CHF On the other hand, heightened tensions in EM and thoughts of global monetary tightening sent the safe-haven JPY and CHF higher. Although I’m bearish on these currencies in the medium term, they could appreciate further as investors continue to cut their EM positions. During the EM turmoil in 2011 there was a close correlation between EM turmoil as measured by the EM VIX index and USD/JPY (see graph).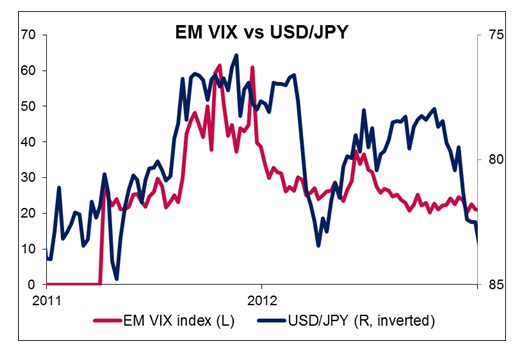 USD/JPY" title="Vix vs USD/JPY" height="242" width="474">
Today’s indicators: During the European day, the German unemployment rate for January is expected to remain unchanged at 6.9% and the country’s preliminary CPI is forecast to be down 0.6% mom in January, a turnaround from +0.5% mom in December. Nonetheless, the yoy rate is estimated to accelerate slightly to 1.3% from 1.2%. That could take some pressure off the ECB to ease and therefore be EUR-positive. From Eurozone as a whole we have the final consumer confidence index for January. In UK, BoE mortgage approvals for December are forecast to be higher than in November, confirming that the housing boom continues.
In the US, along with the GDP figures, initial jobless claims for the week ended on Jan. 25 are expected to rise to 330k from 326 the previous week, while the continuing claims are forecast to fall to 3000k from 3056k. Pending home sales for December are estimated to have fallen 0.3% mom, from a rise of 0.2% in November.
The Market
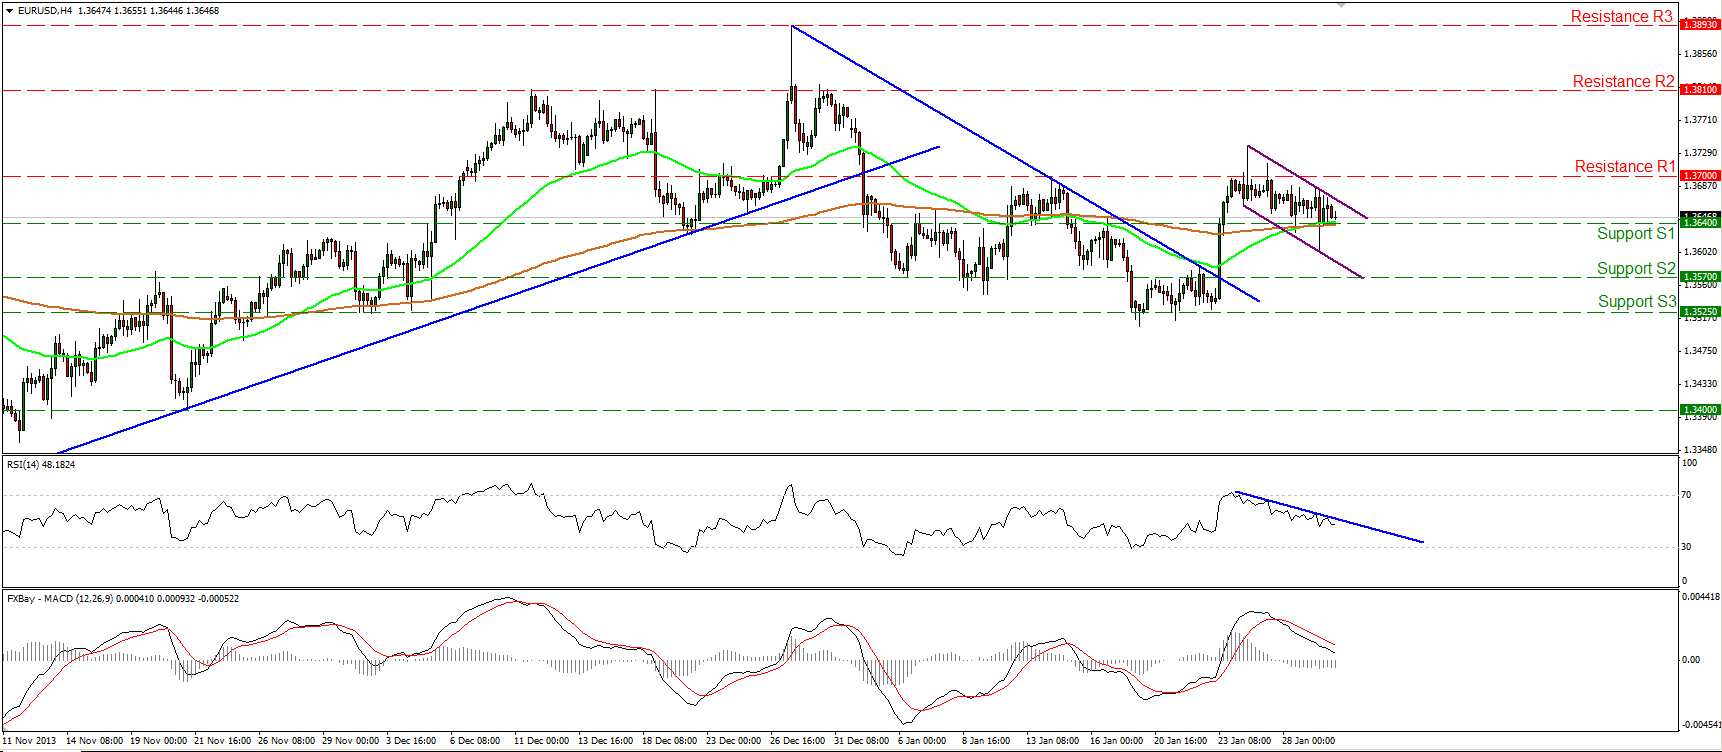 EUR/USD" title="EUR/USD" align="bottom" border="0" height="242" width="474">
• EUR/USD moved in a consolidative mode yesterday and is now finding support near the moving averages. A clear break below the moving averages may target the area between 1.3525 (S3) and 1.3570 (S2). On the other hand, a successful break above 1.3700 (R1) may open the way towards 1.3810 (R2). Both momentum studies continued moving lower, while the MACD, although in bullish territory, remains below its signal line, confirming the decelerating momentum for now.
• Support: 1.3640 (S1), 1.3570 (S2), 1.3525 (S3).
• Resistance: 1.3700 (R1), 1.3810 (R2), 1.3893 (R3).
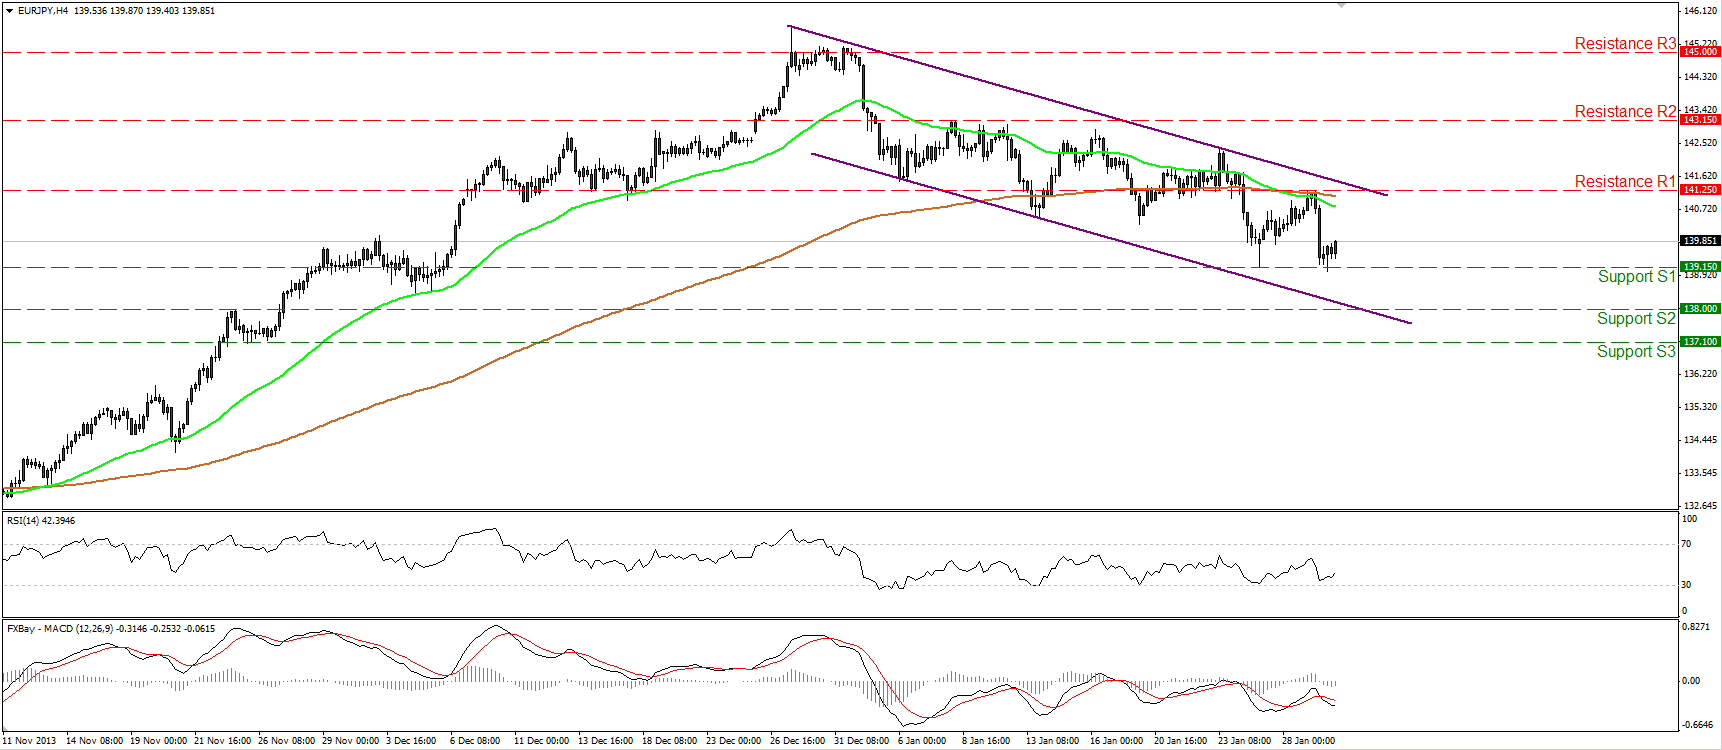 EUR/JPY" title="EUR/JPY" align="bottom" border="0" height="242" width="474">
• EUR/JPY found resistance at 141.25 (R1), near the moving averages, and moved lower reaching the support level of 139.15 (S1). The pair now consolidates slightly above that barrier, the violation of which may trigger extensions towards the lower boundary of the downward sloping channel and the next support at 138.00 (S2). As long as the pair is trading below both the moving averages, within the downward sloping channel, the short-term picture remains negative. On the daily and weekly charts, the longer-term uptrend is still in progress and I would consider the short-term decline as a retracement of the major upward path, at the moment.
• Support: 139.15 (S1), 138.00 (S2), 137.10 (S3).
• Resistance: 141.25 (R1), 143.15 (R2), 145.00 (R3).
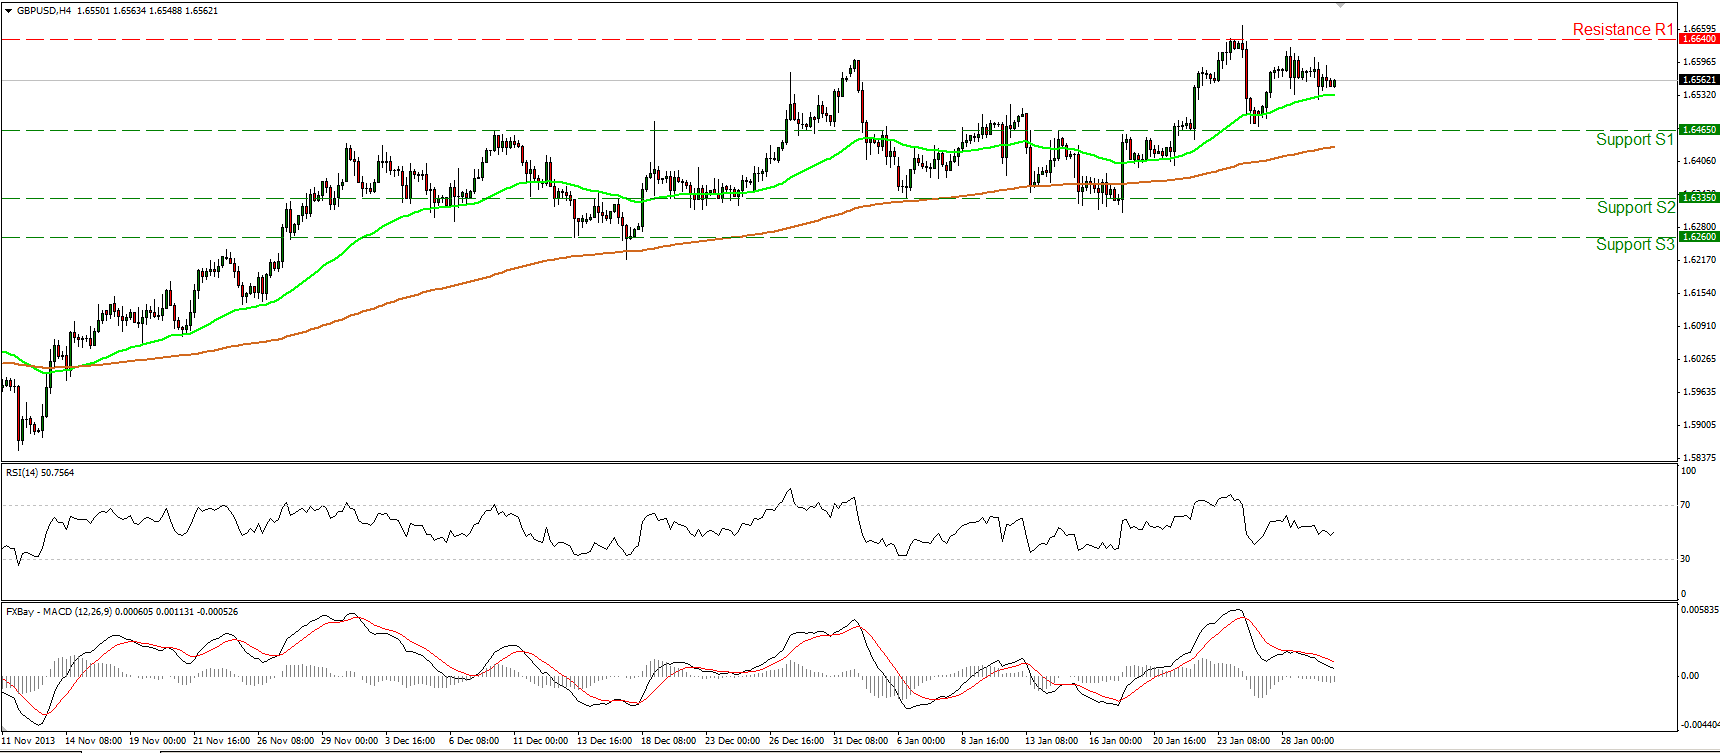 GBP/USD" title="GBP/USD" align="bottom" border="0" height="242" width="474">
• GBP/USD moved in a consolidative mode slightly above the 50-period moving average. The pair remains below the resistance of 1.6640 (R1). If the longs are strong enough to overcome that barrier, we may experience extensions towards the next hurdle at 1.6735 (R2). On the other hand, a break below the support of 1.6465 (S1) is needed to trigger further possible declines. On the daily chart, the rate is trading above both the moving averages with the 50-day moving average supporting the lows of the price action, thus I consider the longer term upward path intact for now.
• Support: 1.6465 (S1), 1.6335 (S2), 1.6260 (S3).
• Resistance: 1.6640 (R1), 1.6735 (R2), 1.6885 (R3).
Gold

• Gold rebounded from the 1250 (S1) barrier, near the longer term downtrend line, and moved higher, but the advance was halted once again by the resistance barrier of 1268 (R1). If the bulls regain momentum and manage to overcome that obstacle, I would expect them drive the battle higher and challenge the next resistance at 1290 (R2). The MACD rebounded near its zero line and crossed above its trigger, confirming the recent bullish momentum. Alternatively, a break below the low at 1250 (S1) may complete a failure swing to the downside and may change the short-term outlook of the precious metal.
• Support: 1250 (S1), 1235 (S2), 1224 (S3).
• Resistance: 1268 (R1), 1290 (R2), 1315 (R3).
Oil

• WTI gave another test of the blue uptrend line near the 96.50 (S1) support level and moved higher. The price is now heading towards the 97.85 (R1) resistance hurdle, the violation of which may open the way towards the next resistance at 98.90 (R2). The MACD remains in its positive territory and lies above its signal line, indicating bullish momentum. As long as the price is trading above the short-term trend line and above both the moving averages, I consider the short-term outlook positive.
• Support: 96.50 (S1), 95.00 (S2), 94.00 (S3).
• Resistance: 97.85 (R1), 98.90 (R2), 100.55 (R3).
BENCHMARK CURRENCY RATES - DAILY GAINERS AND LOSERS

MARKETS SUMMARY
Disclaimer: This information is not considered as investment advice or investment recommendation but instead a marketing communication. This material has not been prepared in accordance with legal requirements designed to promote the independence of investment research, and that it is not subject to any prohibition on dealing ahead of the dissemination of investment research. IronFX may act as principal (i.e. the counterparty) when executing clients’ orders. This material is just the personal opinion of the author(s) and client’s investment objective and risks tolerance have not been considered. IronFX is not responsible for any loss arising from any information herein contained. Past performance does not guarantee or predict any future performance. Redistribution of this material is strictly prohibited. Risk Warning: Forex and CFDs are leveraged products and involves a high level of risk. It is possible to lose all your capital. These products may not be suitable for everyone and you should ensure that you understand the risks involved. Seek independent advice if necessary. IronFx Financial Services Limited is authorised and regulated by CySEC (Licence no. 125/10). IronFX UK Limited is authorised and regulated by FCA (Registration no. 585561). IronFX (Australia) Pty Ltd is authorized and regulated by ASIC (AFSL no. 417482)