Economies around the world continue to experience synchronized growth, as they have since the second half of 2016. However, there is some chatter going around about a slowdown in the global economy. I am not seeing it in the stats I follow. Consider the following:
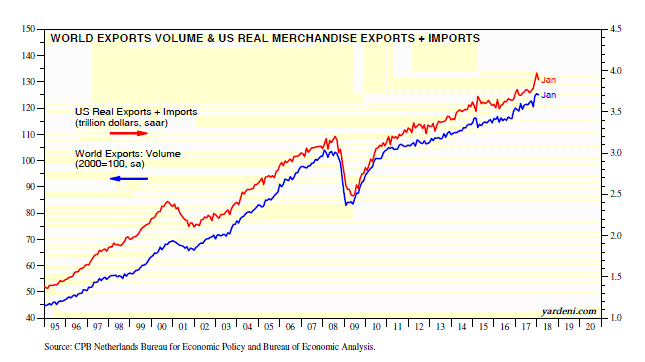
(1) Global trade at record levels. I don’t expect a trade war. Global trade remains at a record high. I believe that countries have become too interdependent to resort to widespread prohibitive protective barriers. The volume of world exports rose 4.5% y/y to a record high during December 2017. The sum of inflation-adjusted US imports and exports closely tracks the global measure of world exports. It was up 3.0% y/y during January, edging down from December’s recent high. The growth rates of both measures have been running around 4.0% since late 2016, a significant improvement from the near-zero growth rates during late 2015 and early 2016.
Given the importance of China in world trade, I also note that the sum of Chinese imports and exports, in nominal terms, rose 19.3% y/y to a record high of 30.0 trillion yuan during February.
(2) Global M-PMI remains high. Some of the recent concerns about global growth focused on the decline in March’s global M-PMI to 53.4 from a recent high of 54.5 at the end of last year. The weakness was led by a drop in the M-PMI for advanced economies from 56.3 during January to 54.9 in March. However, the March readings for both the global and advanced M-PMIs remain solidly above 50.0.
The March levels for the US (59.3), Eurozone (56.6), the UK (55.1), and Japan (53.1) were all down from recent cyclical highs but solid nonetheless. The March M-PMIs for the major emerging economies were more muted for Russia (50.6), India (51.0), China (51.5), and Brazil (53.4). But again, they all exceeded 50.0. Keep in mind that PMIs are diffusion indexes. That means that if the current month was just as good as the previous month, the diffusion index will be around 50.0.
By the way, I've found that the sum of the US M-PMI sub-indexes for new export orders and imports is highly correlated with the growth rate of the volume of world exports on a y/y basis. The former rose to a record high of 123.3 during February and edged down to 118.4 in March. The US is experiencing a trade boom, with both real merchandise exports and imports in record-high territory. The problem is that the latter exceeds the former by $837 billion (saar).
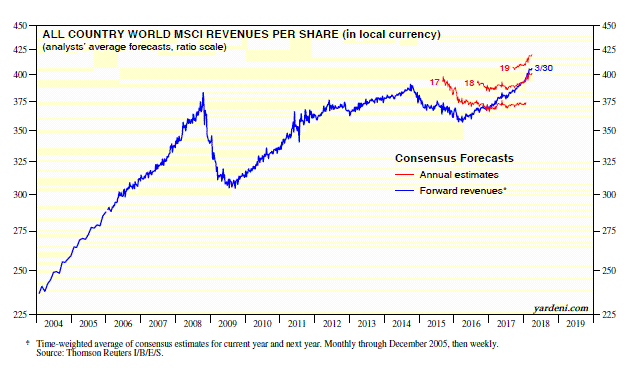
(3) MSCI forward revenues moving higher. I’ve also found that we can track the global economy on a weekly basis using analysts’ consensus expectations for revenues over the next 52 weeks for the major MSCI stock price indexes. To derive these “forward revenues” series, I use a time-weighted average of analysts’ consensus expectations for the current year and the coming year. The current year has more weight than the coming year at the present time. By the middle of the year, they will be equally weighted. By year-end, forward revenues will be the same as the consensus expectations for 2019.
The broadest measure of forward revenues per share is the one for the All Country World MSCI (in local currencies). It dropped sharply from its record high during the summer of 2014 and bottomed in early 2016. That drop reflected the depressing impact of the plunge in oil prices on the world energy industry. Since then, oil prices have recovered but remain well below the levels of early 2014. The revenues measure also has recovered and has been rising in record-high territory this year. Industry analysts have been raising their global revenues estimates for both 2018 and 2019.
(4) NRRIs are in positive territory. I also track Net Revenues Revisions Indexes (NRRIs) for the major MSCI stock price indexes. Keep in mind that analysts have a tendency to be too optimistic, so it isn’t unusual to see NRRIs in negative territory even as the global economy is growing and stock prices are moving higher. The NRRI for the All Country World MSCI has been positive since February 2017, and increasingly so since late 2017. This measure of net revenues revisions was in negative territory every single month from July 2012 through January 2017!


