Get 40% Off
👀 👁 🧿 All eyes on Biogen, up +4,56% after posting earnings. Our AI picked it in March 2024.
Which stocks will surge next?
Unlock AI-picked Stocks

GBP/USD, EUR/JPY: Fibonacci Retracement Analysis

Published 08/26/2020, 06:14 AM
Updated 07/09/2023, 06:32 AM

GBP/USD

As we can see in the daily chart, GBP/USD has reached a long-term 61.8% Fibonacci while moving within the uptrend. At the same time, the MACD indicator is forming a local divergence, which may hint at a possible pullback. The closest downside target may be the local support at 50.0% Fibonacci (1.2895). After completing the correction, the next rising impulse may be heading towards the long-term 76.0% Fibonacci at 1.3660.
GBPUSD_D1
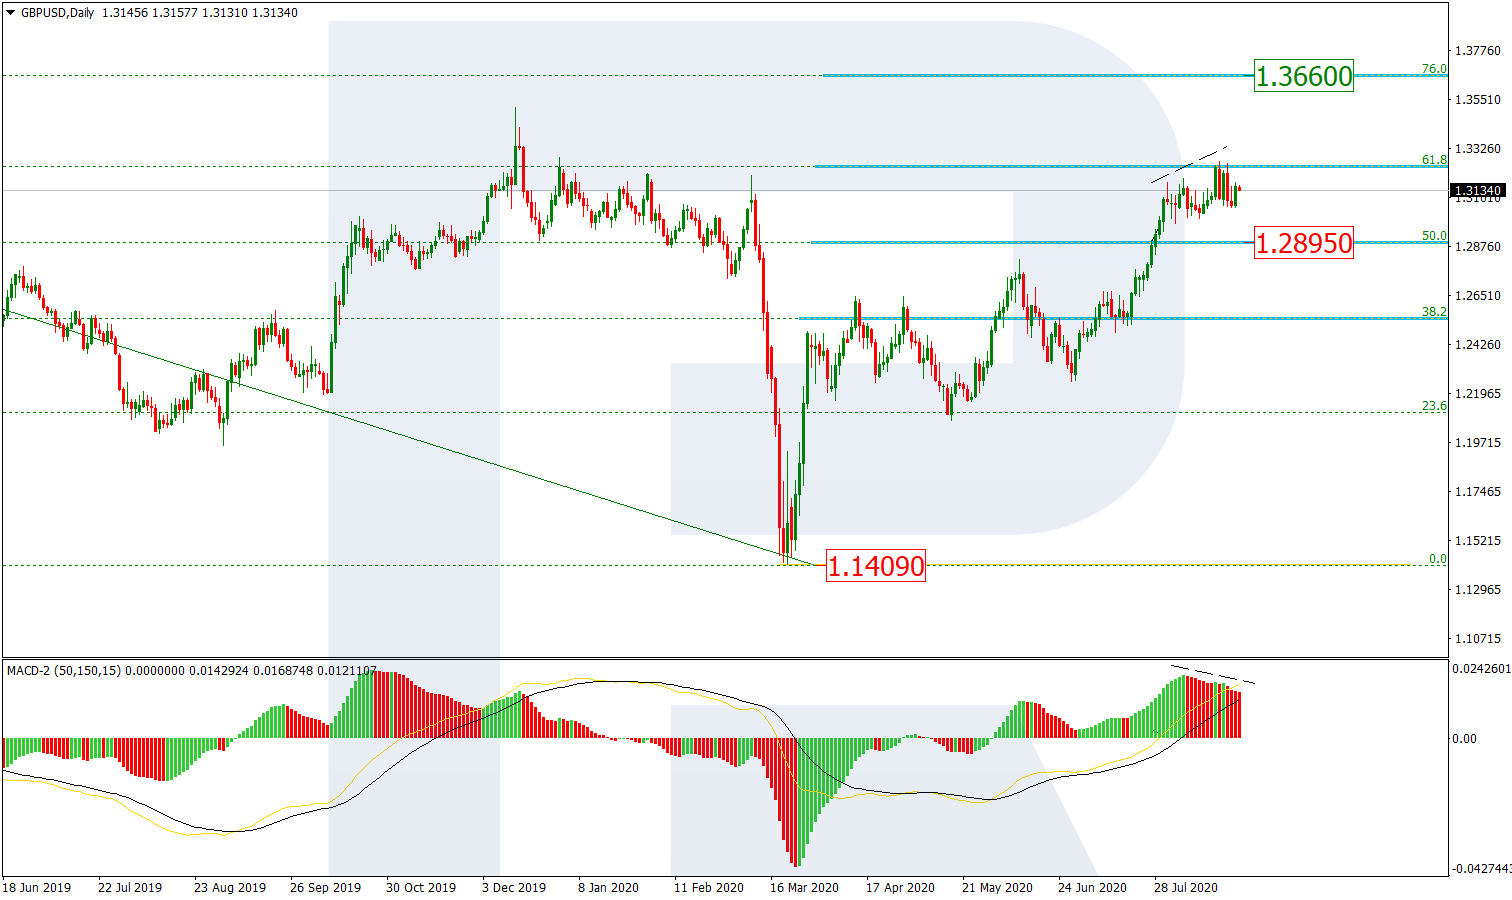
In the H4 chart, the pair has reached the post-correctional extension area between 138.2% and 161.8% Fibonacci. At the same time, the MACD indicator is forming a divergence, which may hint at a new correction. The closest target of this pullback may be 23.6% Fibonacci at 1.3028, while the next ones are 38.2%, 50.0%, and 61.8% Fibonacci at 1.2879, 1.2759, and 1.2640 respectively. However, if the price breaks the high at 1.3267, the instrument may continue the uptrend.
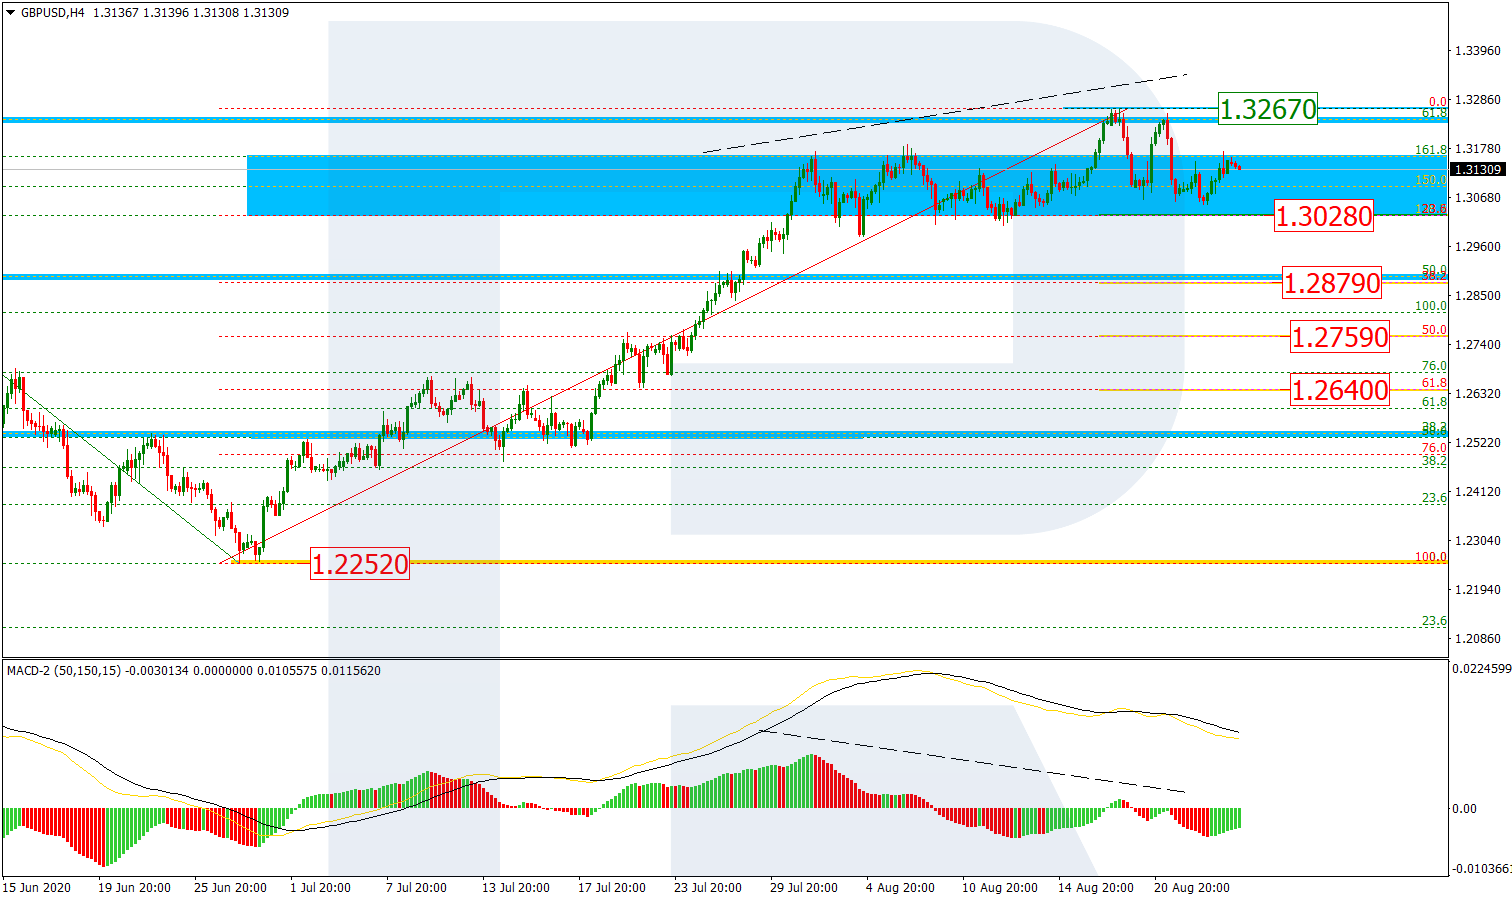
GBPUSD_H4

EUR/JPY

As we can see in the daily chart, EUR/JPY has reached the long-term 50.0% fibo and the post-correctional extension area between 138.2% and 161.8% fibo at 126.38 and 127.57 respectively. such a technical picture may indicate a possible correction in the form of a sideways channel. The next upside target may be the long-term 61.8% fibo at 128.65.
EURJPY_D1
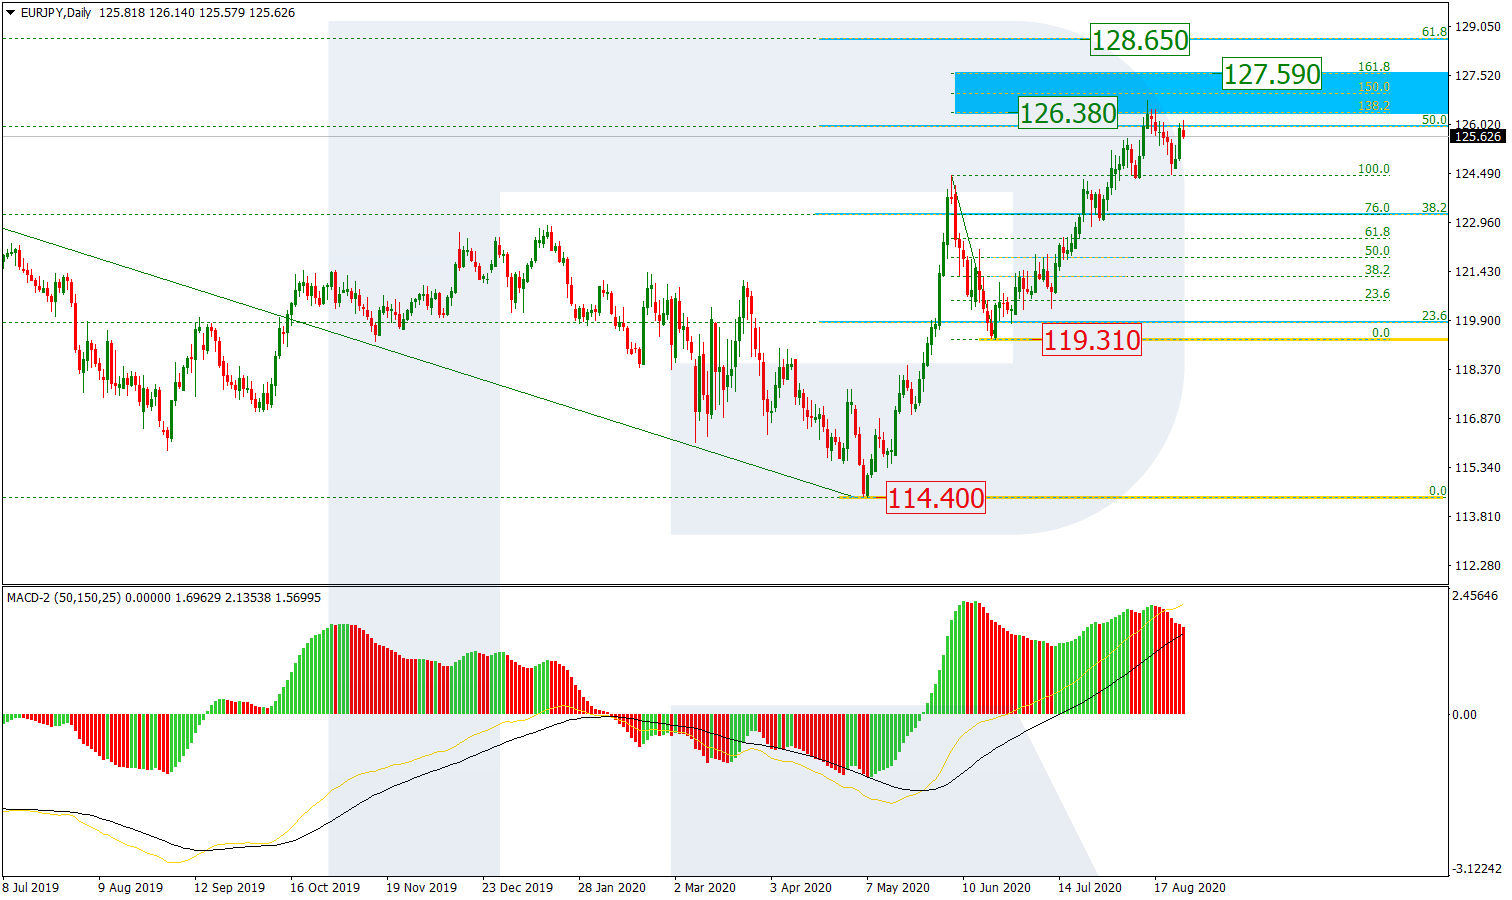
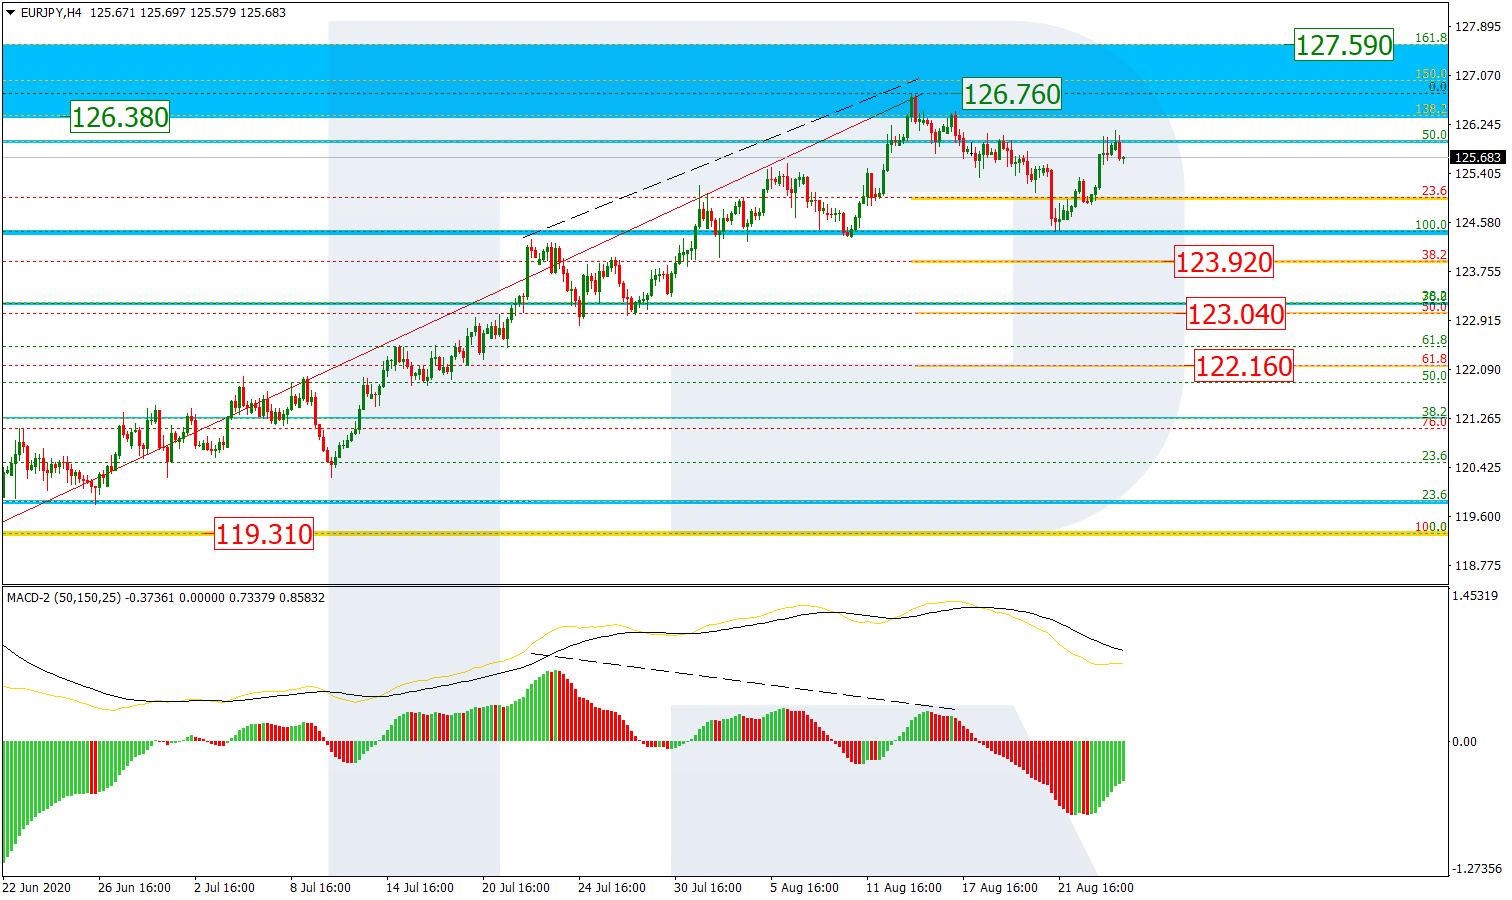
In the H4 chart, after the first descending correctional wave and the divergence, the instrument is forming a local pullback. The first wave has already reached 23.6% Fibonacci and may later continue towards 38.2%, 50.0%, and 61.8% fibo at 123.92, 123.04, and 122.16 respectively. The resistance is the high at 126.76.
EURJPY_H4

3rd party Ad. Not an offer or recommendation by Investing.com. See disclosure here or remove ads .

Latest comments

Risk Disclosure: Trading in financial instruments and/or cryptocurrencies involves high risks including the risk of losing some, or all, of your investment amount, and may not be suitable for all investors. Prices of cryptocurrencies are extremely volatile and may be affected by external factors such as financial, regulatory or political events. Trading on margin increases the financial risks.
Before deciding to trade in financial instrument or cryptocurrencies you should be fully informed of the risks and costs associated with trading the financial markets, carefully consider your investment objectives, level of experience, and risk appetite, and seek professional advice where needed.
Fusion Media would like to remind you that the data contained in this website is not necessarily real-time nor accurate. The data and prices on the website are not necessarily provided by any market or exchange, but may be provided by market makers, and so prices may not be accurate and may differ from the actual price at any given market, meaning prices are indicative and not appropriate for trading purposes. Fusion Media and any provider of the data contained in this website will not accept liability for any loss or damage as a result of your trading, or your reliance on the information contained within this website.
It is prohibited to use, store, reproduce, display, modify, transmit or distribute the data contained in this website without the explicit prior written permission of Fusion Media and/or the data provider. All intellectual property rights are reserved by the providers and/or the exchange providing the data contained in this website.
Fusion Media may be compensated by the advertisers that appear on the website, based on your interaction with the advertisements or advertisers.
© 2007-2024 - Fusion Media Limited. All Rights Reserved.