GBP/USD for Thursday, November 7, 2013
The GBP/USD has done very little over the last 24 hours after it has bounced strongly off the support level at 1.59 over the last few days as it returned back to a short term resistance level around 1.6100. The last couple of weeks has seen the GBP/USD slowly drift lower from the strong resistance level at 1.6250 and down to a three week low just around 1.5900. For the week or so before that the pound moved well from the key level at 1.60 back up to the significant level at 1.6250, only again for this level to stand tall and fend off buyers for several days. Throughout September the pound rallied well and surged higher to move back up strongly through numerous levels which was punctuated by a push through to its highest level for the year just above 1.6250 several weeks ago. In the first week of October the pound was easing back towards 1.60 and 1.59 where it established a narrow trading range between before surging back to 1.6250 again.
Back in the middle of August the pound surged higher to through the resistance level at 1.56 to a then two month high around 1.5650, before spending the next few days consolidating and trading within a narrow range around 1.5650, receiving support from the key 1.56 level. A couple of months ago the resistance level at 1.54 was proving to be quite solid, and once it broke through the pound surged higher to a new seven week high near 1.56 in a solid 48 hour period run. In the week leading up to this the pound had recovered strongly and returned to the previous resistance level at 1.54 after the week earlier undoing some of its good work and falling away sharply from the resistance level at 1.54 back down to around 1.5150 and a two week low. A few weeks ago the 1.54 resistance level stood firm and the pound fell away heavily, however the 1.51 support level proved decisive and helped the pound rally strongly.
Earlier in July after having done very little for about a week, the GBP/USD started to move and surge higher and move through the 1.52 and 1.53 levels to the one month high above 1.54. Prior to the move higher, it moved very little as it found solid support at 1.51 and traded within a narrow range above this level. It established a trading range in between 1.51 and 1.52 after it took a breather from its excitement just prior when it experienced a strong surge higher moving back to within reach of the 1.52 level from below 1.49, all in 24 hours. About a month ago it did well to climb off the canvas and move back above 1.49 and towards 1.50 again before seeing the pound reverse and head back down below 1.49 to reach a new multi-year low near 1.48. It experienced sharp falls moving from 1.53 down to the key long term level of 1.50 and then through 1.49. That movement saw it resume its already well established medium term down trend from the second half of June and move it to a four month low.
British industrial output grew more strongly than expected in September as it bounced back from a fall the previous month, providing some reassurance that the country's economic recovery is not being driven only by consumption. Output in the industrial sector - which makes up about a sixth of Britain's economy - climbed 0.9 percent during the month and was pushed up most strongly by manufacturing, the Office for National Statistics said. Economists had expected a rise of 0.5 percent, according to a Reuters poll of economists. Sterling jumped to a one-week high against the dollar and British government bond prices fell as investors took the data as another sign that the Bank of England might bring forward its timeframe for raising interest rates. But economists cautioned against reading too much into Wednesday's figures and Britain's economy was still being driven by consumption and the services sector. GBP/USD Daily Chart" title="GBP/USD Daily Chart" height="235" width="550">
GBP/USD November 7 at 00:30 GMT 1.6077 H: 1.6117 L: 1.6063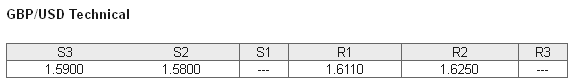 GBP/USD Technical" title="GBP/USD Technical" height="235" width="550">
During the early hours of the Asian trading session on Thursday, the GBP/USD is trading within a narrow range right around 1.6080 after having done very little for the last 24 hours. Since the middle of June the pound has fallen very strongly from the resistance level at 1.57 back down towards the long term key level at 1.50 and is now enjoying a solid resurgence over the last couple of months moving back to above 1.62 and its highest point for the year. Current range: Just around 1.6080.
Further levels in both directions:
• Below: 1.5900 and 1.5800.
• Above: 1.6110 and 1.6250. GBP/USD Open Position Ratios" title="GBP/USD Open Position Ratios" height="235" width="550">
(Shows the ratio of long vs. short positions held for the GBP/USD among all OANDA clients. The left percentage (blue) shows long positions; the right percentage (orange) shows short positions.)
The GBP/USD long positions ratio has moved back above 30% as the GBP/USD has bounced off support at 1.59. Trader sentiment remains heavily in favour of short positions.
Economic Releases
- 00:30 AU Employment (Oct)
- 00:30 AU Unemployment (Oct)
- 05:00 JP Leading indicator (Prelim.) (Sep)
- 12:00 UK BoE MPC - APF Total (Nov)
- 12:00 UK BoE MPC - Base Rate (Nov)
- 12:45 EU ECB - Interest Rate (Nov)
- 13:30 EU ECB President Draghi gives press conference following interest rate announcement
- 13:30 US Core PCE Price Index (1st Est.) (Q3)
- 13:30 US GDP Annualised (1st Est.) (Q3)
- 13:30 US GDP Price Index (1st Est.) (Q3)
- 13:30 US Initial Claims (01/11/2013)
- 20:00 US Consumer Credit (Sep)