EUR/USD
The dollar maintains its latest short term weakness across the board, following the disappointment of NFP last Friday: the US economy created 290K new jobs in July below market expectations, while unemployment rate ticked higher to 6.2%. The EUR/USD however, seems to have a long road ahead before confirming an upward continuation, considering that the latest upward correction from its year low of 1.3366, is still unable to extend above the 23.6% retracement of the 1.3639/1.3366 slide around current levels. Furthermore, sellers had been surging on the 1.3440 price zone earlier past week, so some follow through above it is required to start thinking about buying.
Technically, the hourly chart shows indicators aiming higher near overbought levels, while 200 SMA converges with the mentioned Fibonacci retracement reinforcing its strength. In the 4 hours chart indicators present a strong upward momentum, yet a break above mentioned resistance is required to confirm further intraday advances. A break below 1.3405 on the other hand, will likely see price resuming the downside, looking for fresh lows in the 1.3330/40 price zone.
Support levels: 1.3405 1.3370 1.3335
Resistance levels: 1.3440 1.3475 1.3500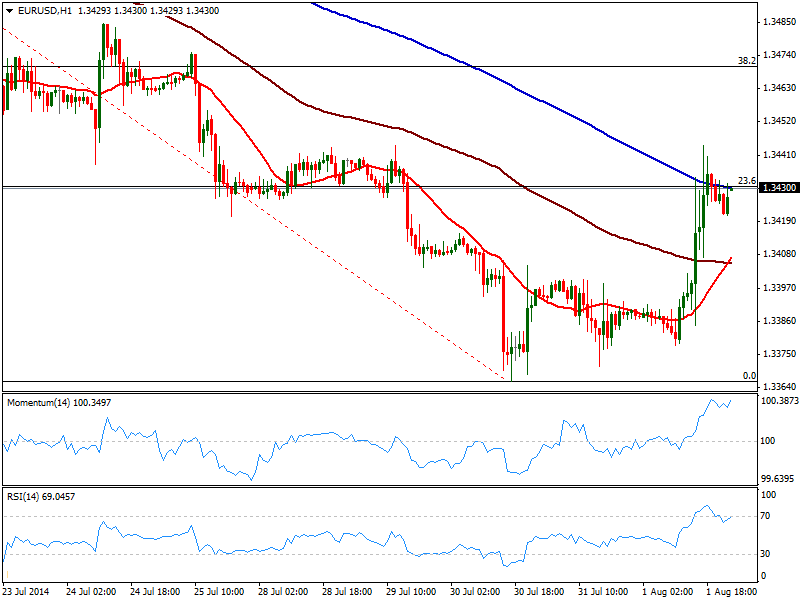
EUR/JPY
The EUR/JPY presents a quite neutral stance trading steadily above 137.50 albeit risk has turned south on yen renewed strength: US indexes are part of it, having had one of their worst losses in this 2014. With both EUR and JPY advancing against the greenback last Friday, it could not be that evident at the time being, but EUR capacity of advancing is quite limited, while Yen strength will likely become more notorious as days go by. Technically, the hourly chart shows indicators with a mild bearish tone as per standing right below their midlines, while moving averages continue heading higher below current price. In the 4 hours chart indicators head lower, but remain in positive territory, suggesting is no yet time to sell. A price acceleration below 137.50 however, may be the first sign of further weakness, eyeing 136.60 as probable bearish target for the day.
Support levels: 137.50 137.90 136.60
Resistance levels: 137.90 138.40 138.85 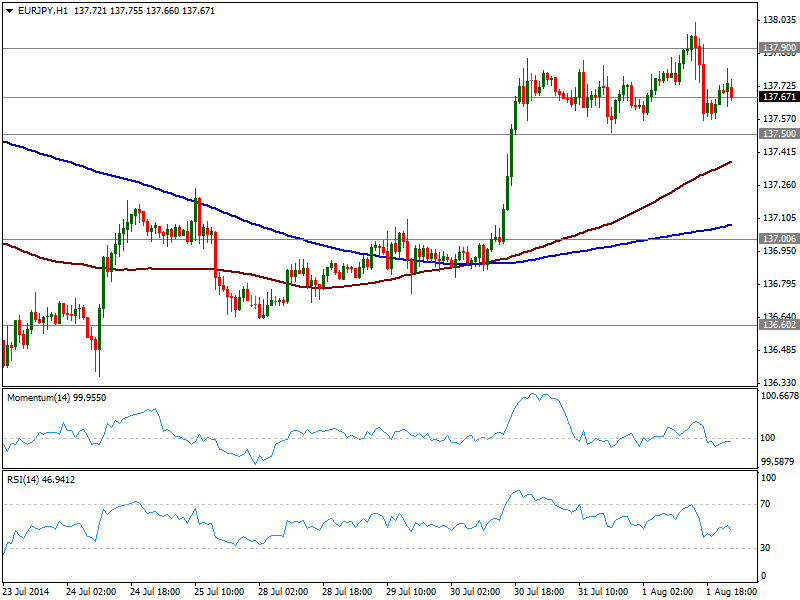
GBP/USD
The GBP/USD extended its decline down to 1.6802 on a slightly disappointing UK manufacturing PMI reading and failed to regain the upside on dollar weakness, suggesting there’s room for more declines ahead. The hourly chart shows price developing below a bearish 20 SMA as indicators aim higher from oversold territory, while the 4 hours chart shows a quite similar picture, with a strongly bearish 20 SMA offering dynamic resistance around 1.6890 and indicators still flat in oversold levels. If price however manages to recover above 1.6860, the bearish pressure should ease and the recovery can extend up to 1.6940, yet below 1.6800 further slides are to be expected.
Support levels: 1.6805 1.6770 1.6735
Resistance levels: 1.6840 1.6890 1.6940 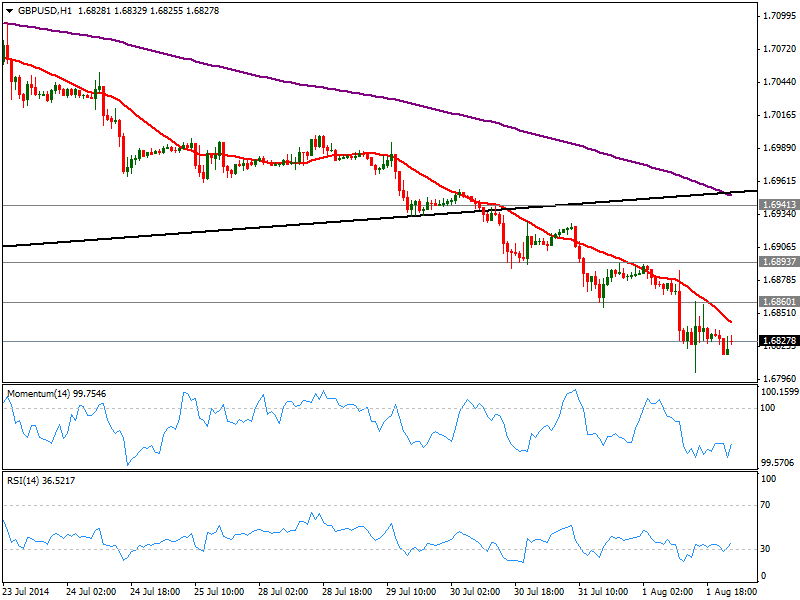
USD/JPY
Repeated failure to advance beyond 103.00 finally took its toll on the USD/JPY down to its mid 102. Technically, the hourly chart shows indicators turning south after correcting oversold readings, while price finds short term support in a still bullish 100 SMA. In the 4 hours chart indicators present a strong bearish tone around their midlines, suggesting further falls are likely: former strong static resistance at 102.35 is the level to watch as a break below exposes the pair to a run towards 101.60 during the upcoming sessions.
Support levels: 102.35 101.95 101.60
Resistance levels: 103.10 103.40 103.80 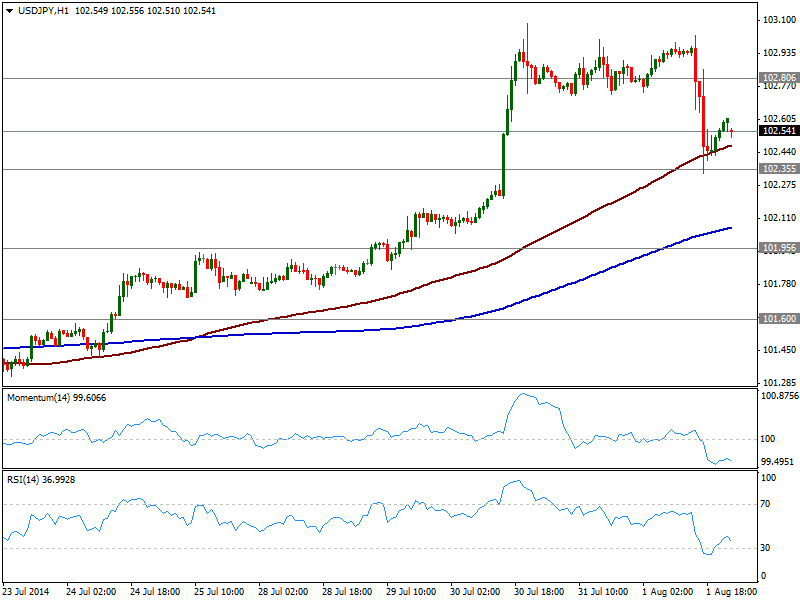
AUD/USD
Aussie weakened on self data late last week, and remains unable to recover the 0.9330 level against the greenback, level that capped the downside for the last 2 months. Technically however, the hourly chart shows price steady above its 20 SMA and indicators heading north in positive territory, suggesting at least an upward correction before a new leg down. In the 4 hours chart however, price stands below a strongly bearish 20 SMA while indicators aim higher below their midlines. Price needs not only to break but also to consolidate above the 0.9330 level to discourage selling interest and attempt an upward correction towards the 0.9370 area. Below 0.9260 on the other hand the bearish potential increases, looking then for a steady fall towards 0.9000 over the upcoming days.
Support levels: 0.9260 0.9220 0.9175
Resistance levels: 0.9330 0.9370 0.9420 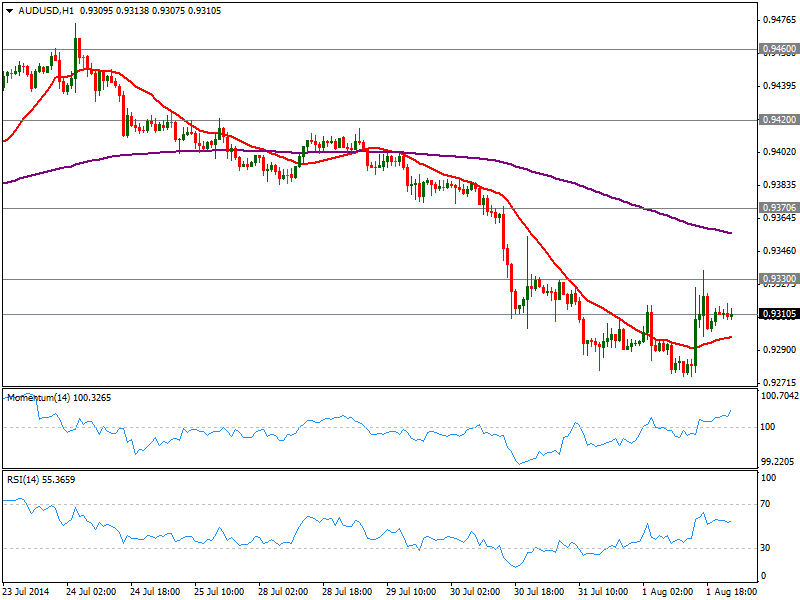
AUD/NZD
The AUD/NZD has shown little progress last Friday, still hovering in a tight range around the 23.6% retracement of the 1.0622/1.1047 rally, unable to clearly establish above it, yet not able to run far away below it either. The upcoming Asian session will be fulfilled with Australian data that may affect the pair and finally set a direction, but in the meantime, the hourly chart presents a mild negative tone, with indicators flat around their midlines, and price below 100 and 200 SMAs. In the 4 hours chart, 20 SMA gains bearish slope above current price while indicators stand flat in negative territory, supporting further falls: a downward acceleration below 1.0915 however is now required to confirm a move towards 1.0830/50 price zone.
Support levels: 1.0915 1.0885 1.0835
Resistance levels: 1.0948 1.075 1.1000 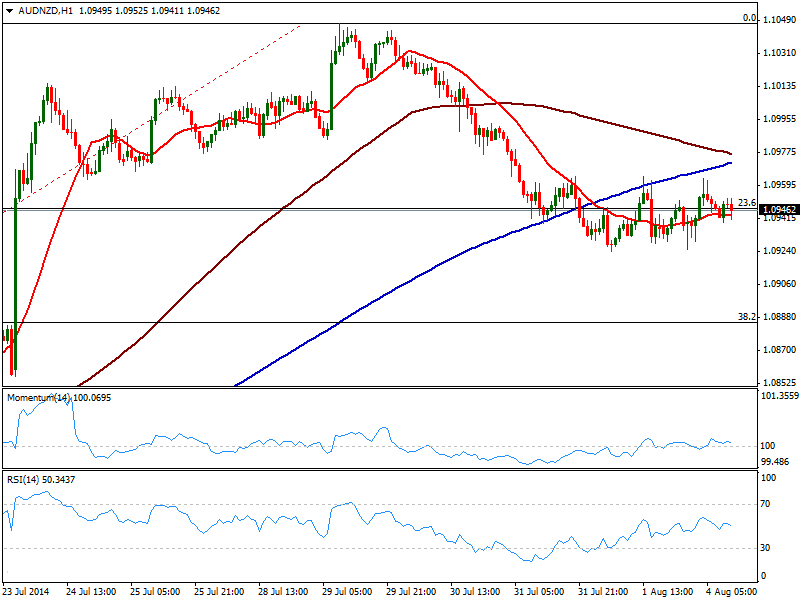
XAU/USD
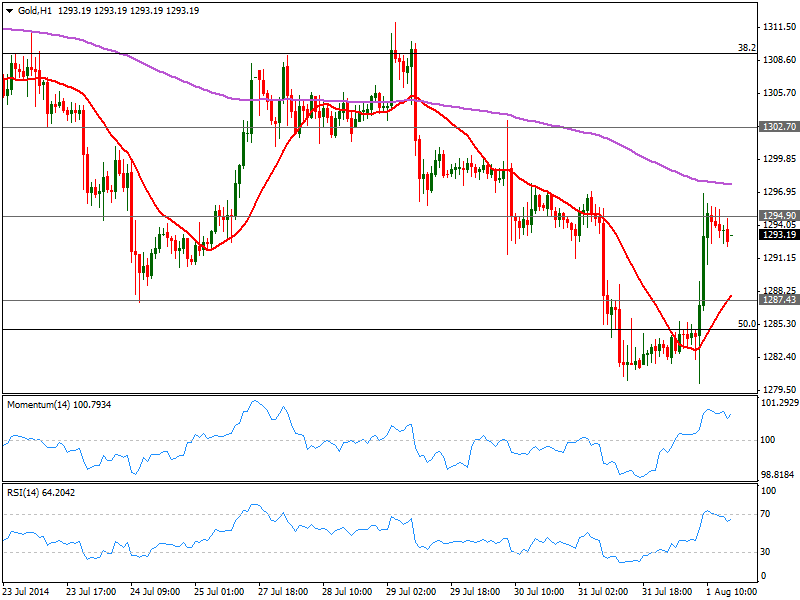
Gold erased some of its weekly losses on Friday, recovering up to 1295 price zone before stalling, and having set a fresh multi-week low of 1280.10. Technically, the hourly chart shows 20 SMA heading higher below current price in the 1287.40 price zone, offering immediate short term support, while indicators head higher after correcting overbought readings. In the 4 hours chart the technical stance is neutral, with momentum and RSI flat around their midlines and price hovering around its 20 SMA: a recovery above 1302.70 is required to limit further downside risk, favoring then a recovery towards 1309.30 Fibonacci resistance.
Support levels: 1287.40 1274.25 1266.00
Resistance levels: 1302.70 1309.30 1316.30 