Micron shares surge amid sharply higher revenue forecasts on AI-led memory demand

GBP/JPY is moving down inside the Clear Triangle chart pattern identified on the daily charts. We rate the overall Quality of this chart pattern at the 6 bar level as a result of the low Initial Trend (measured at the 3 bar level), above-average Uniformity (6 bars) and substantial Clarity (8 bars).
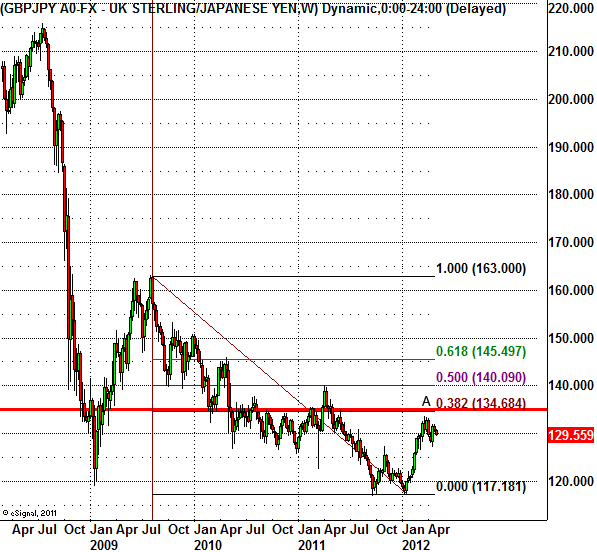
This Triangle continues the predominant downtrend visible on the daily and the weekly GBP/JPY charts. The top of this chart pattern (point A on the chart below) formed when the pair reversed down from the resistance area made out of the 38.2% Fibonacci Retracement of the previous extended weekly downward price impulse from the August of 2009 as well as the resistance level 135.00 (as is shown on the second chart below). The pair is expected to fall further toward the lower support trend line of this Triangle in the nearest time.

The following weekly GBP/JPY chart highlights the technical price levels mentioned above:
 GBP/JPY" title="GBP/JPY" width="597" height="552" />
This Triangle continues the predominant downtrend visible on the daily and the weekly GBP/JPY charts. The top of this chart pattern (point A on the chart below) formed when the pair reversed down from the resistance area made out of the 38.2% Fibonacci Retracement of the previous extended weekly downward price impulse from the August of 2009 as well as the resistance level 135.00 (as is shown on the second chart below). The pair is expected to fall further toward the lower support trend line of this Triangle in the nearest time.
The following weekly GBP/JPY chart highlights the technical price levels mentioned above:
GBP/JPY" title="GBP/JPY" width="597" height="552" />