
Information technology services provider Gartner, Inc. (NYSE:IT) reported relatively healthy fourth-quarter 2017 results with year-over-year growth in revenues and total contract value. Adjusted earnings for the reported quarter were $108 million or $1.17 per share compared with $81.2 million or 97 cents per share in the year-ago quarter. The year-over-year increase in adjusted earnings was primarily attributable to top-line growth and favorable impact from the Tax Act. Adjusted earnings for fourth-quarter 2017, however, missed the Zacks Consensus Estimate of $1.28.
Gartner recorded GAAP net income of $107.3 million or $1.16 per share compared with $66.5 million or 79 cents per share in the prior-year quarter. The year-over-year increase in GAAP earnings was largely due to higher revenues which increased 44% year over year. For full year 2017, GAAP earnings were $3.3 million or 4 cents per share compared with $193.6 million or $2.31 per share in 2016. Despite higher revenues, GAAP earnings for 2017 decreased year over year due to higher operating expenses.
Total non-GAAP revenues for the reported quarter increased to $1,064.6 million from $703.2 million due to solid contract value growth and accretive acquisitions. Total contract value for traditional Gartner business was approximately $2.2 billion, up 15% year over year. For full year 2017, non-GAAP revenues were $3,516.9 million compared with $2,444.5 million in 2016.
Adjusted EBITDA (earnings before interest, tax, depreciation and amortization) for the quarter increased to $220.9 million from $145.1 million in the prior-year period.
Gartner, Inc. Price, Consensus and EPS Surprise
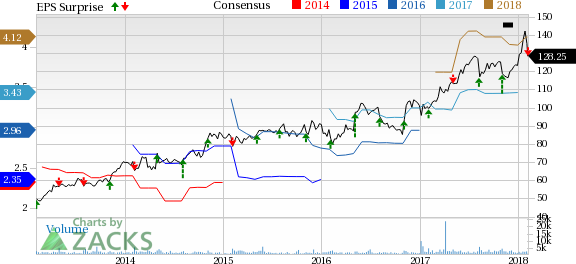
Gartner, Inc. Price, Consensus and EPS Surprise | Gartner, Inc. Quote
Segmental Performance
Research segment’s revenues increased 43% to $692.8 million and accounted for 68.3% of GAAP revenues. Client retention was 84%, while wallet retention was 106%. The quarterly gross contribution margin was 67% for the quarter, down from 68% in the year-ago period.
Consulting revenues declined to $85.3 million from $81.1 million in the prior-year period, accounting for 8.4% of total revenues. Backlog, the key leading indicator of future revenue growth for the Consulting business, was $95.2 million compared with $88.6 million in the prior-year period. Gross contribution margin was 26% compared with 23% in the year-earlier quarter.
Events revenue was significantly up from $136.3 million to $166.5 million. Gross contribution margin was 51%, down from 54% in the fourth quarter of 2016.
Talent Assessment & Other revenues for fourth-quarter 2017 was $70 million, while gross contribution margin was 60%.
Balance Sheet and Cash Flow
At quarter end, Gartner had about $538.9 million in cash and cash equivalents with long-term debt of $3,278.8 million compared with respective tallies of $474.2 million and $694.4 million in the prior-year period. Net cash from operating activities for 2017 was $254.5 million compared with cash flow of $365.6 million in the year-earlier period, resulting in respective free cash flow of $264.6 million and $347.2 million.
During 2017, Gartner used $2.6 billion for acquisitions, $41.3 million to repurchase shares and $110.8 million for capital expenditures. As of Dec 31, 2017, the company had $558 million of additional borrowing capacity under its revolving credit facility.
Guidance
Gartner offered preliminary guidance for full year 2018. The company currently expects GAAP revenues in the range of $4,095–$4,200 billion and adjusted EPS in the range of $3.71–$4.11. Operating cash flow is likely to be within $460–$510 million.
Gartner presently has a Zacks Rank #3 (Hold). Some better-ranked stocks in the industry include Cintas Corporation (NASDAQ:CTAS) , UniFirst Corporation (NYSE:UNF) and Exponent, Inc. (NASDAQ:EXPO) , each carrying a Zacks Rank #2 (Buy). You can see the complete list of today’s Zacks #1 Rank (Strong Buy) stocks here.
Cintas has long-term earnings growth expectation of 12%. It has a positive earnings surprise history with an average of 8.2% in the trailing four quarters, beating estimates on all occasion.
UniFirst has a long-term earnings growth expectation of 10%. It has a positive earnings surprise history with an average of 10.2% in the trailing four quarters, beating estimates on all occasion.
Exponent has topped estimates thrice in the trailing four quarters with an average positive earnings surprise of 12.4%.
More Stock News: This Is Bigger than the iPhone!
It could become the mother of all technological revolutions. Apple (NASDAQ:AAPL) sold a mere 1 billion iPhones in 10 years but a new breakthrough is expected to generate more than 27 billion devices in just 3 years, creating a $1.7 trillion market.
Zacks has just released a Special Report that spotlights this fast-emerging phenomenon and 6 tickers for taking advantage of it. If you don't buy now, you may kick yourself in 2020.
Click here for the 6 trades >>
Gartner, Inc. (IT): Free Stock Analysis Report
Cintas Corporation (CTAS): Free Stock Analysis Report
Unifirst Corporation (UNF): Free Stock Analysis Report
Exponent, Inc. (EXPO): Free Stock Analysis Report
Original post
Zacks Investment Research