With option trading volume up substantially this year, there is an increasing need to understand gamma and related metrics.
One of the concepts market professionals often discuss is the concept of a “gamma flip.” Beware, however, there are differing definitions of what a gamma flip can be.
In our terminology, the gamma flip refers to a regime change.
No, not that kind of regime. Gamma is a financial concept, not a political one. A gamma flip refers to a transition of the markets from one volatility regime to another. In a lower volatility regime, investors can often rest while markets increase in value. In a higher volatility regime, the market can swing wildly, creating investor fear and anxiety.
Gamma Neutral Sets The Volatility Regime
Volatility regime change often occurs when the value of a stock or index falls below what we call the “Gamma Neutral” level. For instance, when the S&P 500 is higher than its Gamma Neutral level, volatility tends to be lower. When the value of the S&P is below Gamma Neutral, volatility increases.
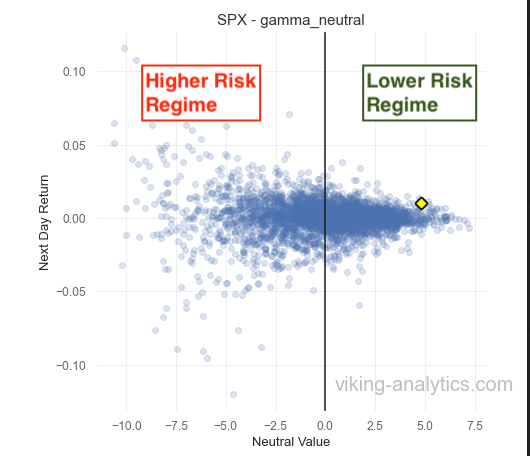
We illustrate this concept in the scatterplot below. When the price of the S&P 500 is above Gamma Neutral (to the right of the bold line), the next day price change is often contained in a narrow range.

Conversely, when the S&P price is lower than Gamma Neutral (to the left of the line above), then the daily price changes in the S&P can swing wildly, both up and down.
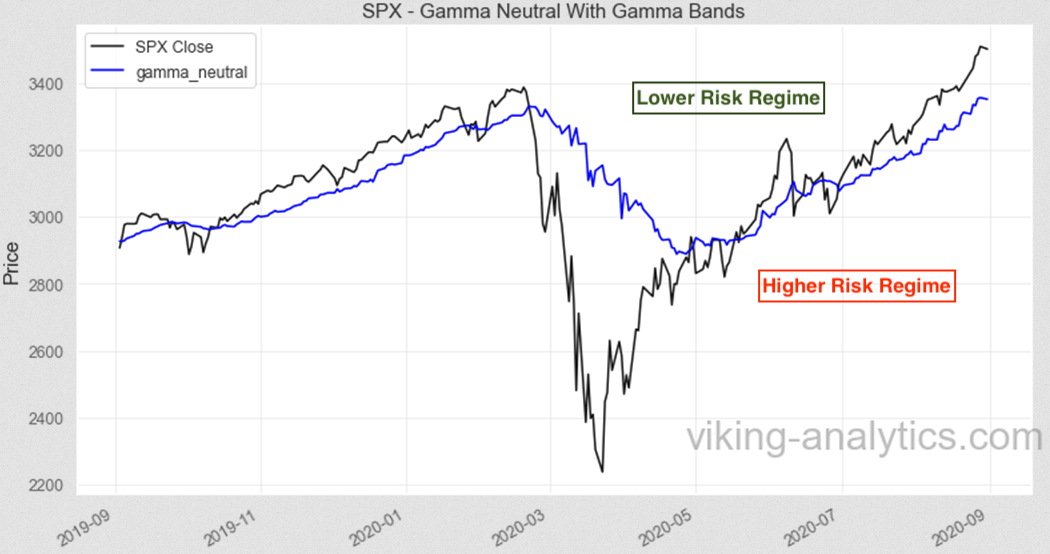
When price crosses above or below the Gamma Neutral level, it often results in a regime change for stock volatility[1].
A chart of the S&P 500 since 2019 shows the higher and lower-risk regimes. With the stock market rising to new highs, we are currently in a lower risk regime.

when the market is below Gamma Neutral. Whether or not this theory is accurate is less material as the clear evidence of a change in volatility above and below the Gamma Neutral level. We don’t need to know “why” in order to act upon evidence.
Side Note (1)
Some market professionals suggest the reason for the “gamma flip” is due to the default behavior of options market makers. This theory purports that options market makers will hedge by buying the S&P when the market is above Gamma Neutral and that they sell the S&P when the market is below Gamma Neutral. Whether or not this theory is accurate is less material as the clear evidence of a change in volatility above and below the Gamma Neutral level. We don’t need to know “why” in order to act upon evidence.
Back-Testing Risk Regime Trading
We set out to construct a back-test that captures value from this principle of Gamma Neutral related regime change.
To do so, we follow a few simple rules to improve our risk-adjusted returns from 2007.
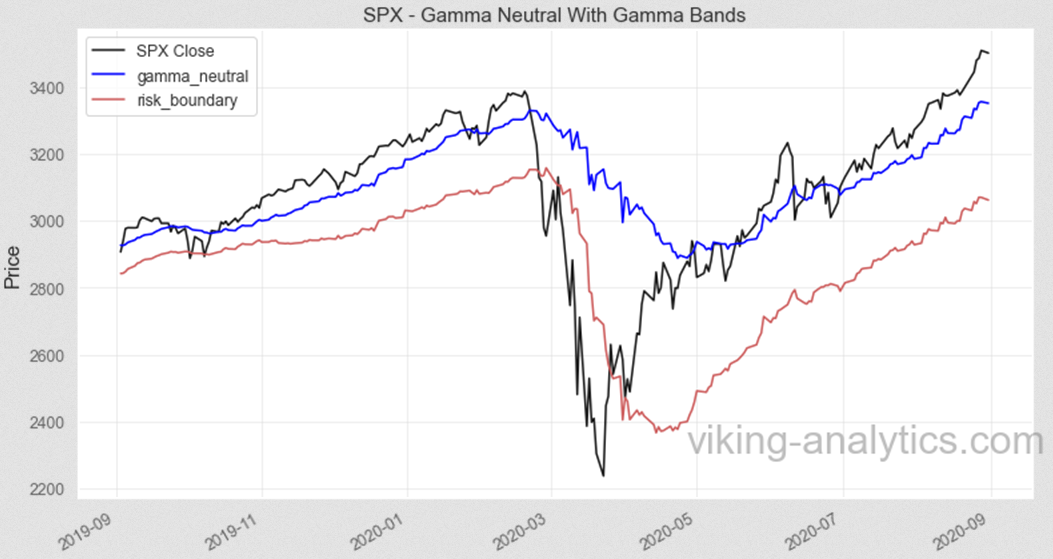
The model assumes a normal state is 100% long the S&P 500 (SPX). When the value of SPX falls below the Gamma Neutral level, the SPX allocation is reduced to 50%. We also created a risk boundary based upon the Gamma Neutral level, where we judge risk as extreme. In that instance, the model reduces the position to 0%. We also embedded other risk adjustments relating to the speed of any sell-off.
The chart below shows the value of the SPX, the Gamma Neutral level, and the risk boundary where the position is exited. It’s important to note that the position is purchased again in part or full as it climbs back above the risk boundary and Gamma Neutral.

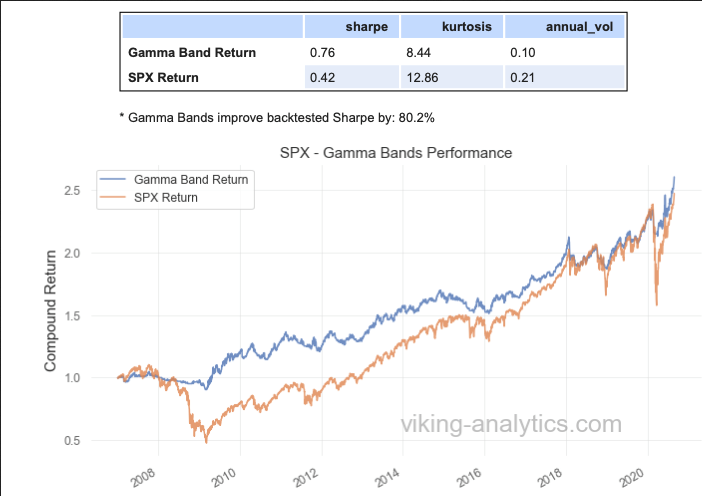
We back-tested this strategy from 2007 to the present and realized an 80% increase in risk-adjusted returns (measured by the Sharpe ratio). The annual volatility of this approach, versus a long-only position, falls from 21% to 10%.

Final Thoughts
With more money flowing through options markets, options metrics have increasing importance in understanding the overall value and market direction.
There has been more media attention relating to gamma levels, but little material on translating it into actionable strategies. Our approach increases the risk-adjusted return by proactively reducing position size in relation to gamma levels.
