- While we still look for risk appetite to remain supported in the near term, USDJPY and the Nikkei are now both trading at key downside levels, providing warning signals of a potential ensuing correction.
- Special attention is now warranted for USDJPY at the 96.56 level, of which a close below would confirm an overall bearish outlook.
- Continued easy global monetary conditions, with the Federal Reserve leaving the door wide open to its central bank peers to continue to maintain their respective easy monetary stances, and
- Increasingly improved growth numbers from mature economies such as the euro-area and the US.
As my colleague Kristian Siggaard-Jensen pointed out in his blog post earlier today EURUSD needs to close above 1.3833 to keep bullish bias and as I stated in a recent post on the attractiveness of the Hungarian forint, we still see global risk sentiment supported in the near term, with the balance now having been tilted to the positive.
This tilt has come to fruition due to a combination of two factors:
In the past few days, however, positive risk appetite has not spilled over to Japanese stocks or the yen in the manner that markets of late have become accustomed to. Below we look at some fundamental challenges Japan is faced with and revisit the technical picture for USDJPY.
Increasing signs of potential correction in Japanese markets ahead
The Nikkei 225 has staged a remarkable rally since the introduction of heavy fiscal stimulus, the so-called 'Abenomics' under Prime Minister Shinzo Abe, and the implementation of a Japanese version of quantitative easing. While structural reforms (one of three components of the Abenomic approach) are indeed much needed in the still relatively closed Japanese economy, these reforms will take a long time to implement, with little 'instant benefits' in sight. On the other hand, fiscal and monetary stimulation both create their own risks with various crowding-out and structurally distorting effects in the long run, of which the details are far beyond the scope of this post.
While Japanese inflation numbers are steadily rising (as seen once again in the overnight release of Japanese September price data that narrowly beat estimates), and have been widely seen as confirmation of successful monetary policy combating sticky deflationary pressures in Japan, much of the rise has been attributable to elevated energy-related import prices. The latter have been driven higher due to nearly all of Japan's nuclear energy production capacity being forced into hibernation mode following the Fukushima nuclear disaster.
On the other hand, the Japanese trade balance, once a bedrock source of capital inflows, has steadily deteriorated in the last year and half, reversing a multi-decade run of surpluses. This deterioration in Japan's balance of payments, for its part, has made the yen a much less attractive safe-haven currency than it once was. While the yen retains its general status as a go-to currency in times of suffering risk appetite, as has been seen with the latest episode of rising Chinese money market yields, poorer current account flows will continue to challenge the yen's safe-haven role.
Based on the backdrop above, we revisit the USDJPY technical picture, with special focus on the downside levels that warrant attention.
A potential USDJPY close below 200-day m.a. opens yen up for more strength
USDJPY has found little buying interest after it closed below trend-line support from the August 2013 lows. A potential close below the 200-day moving average today, presently at 97.33, would make USDJPY very vulnerable for further downside in the weeks to come.
USDJPY on a daily scale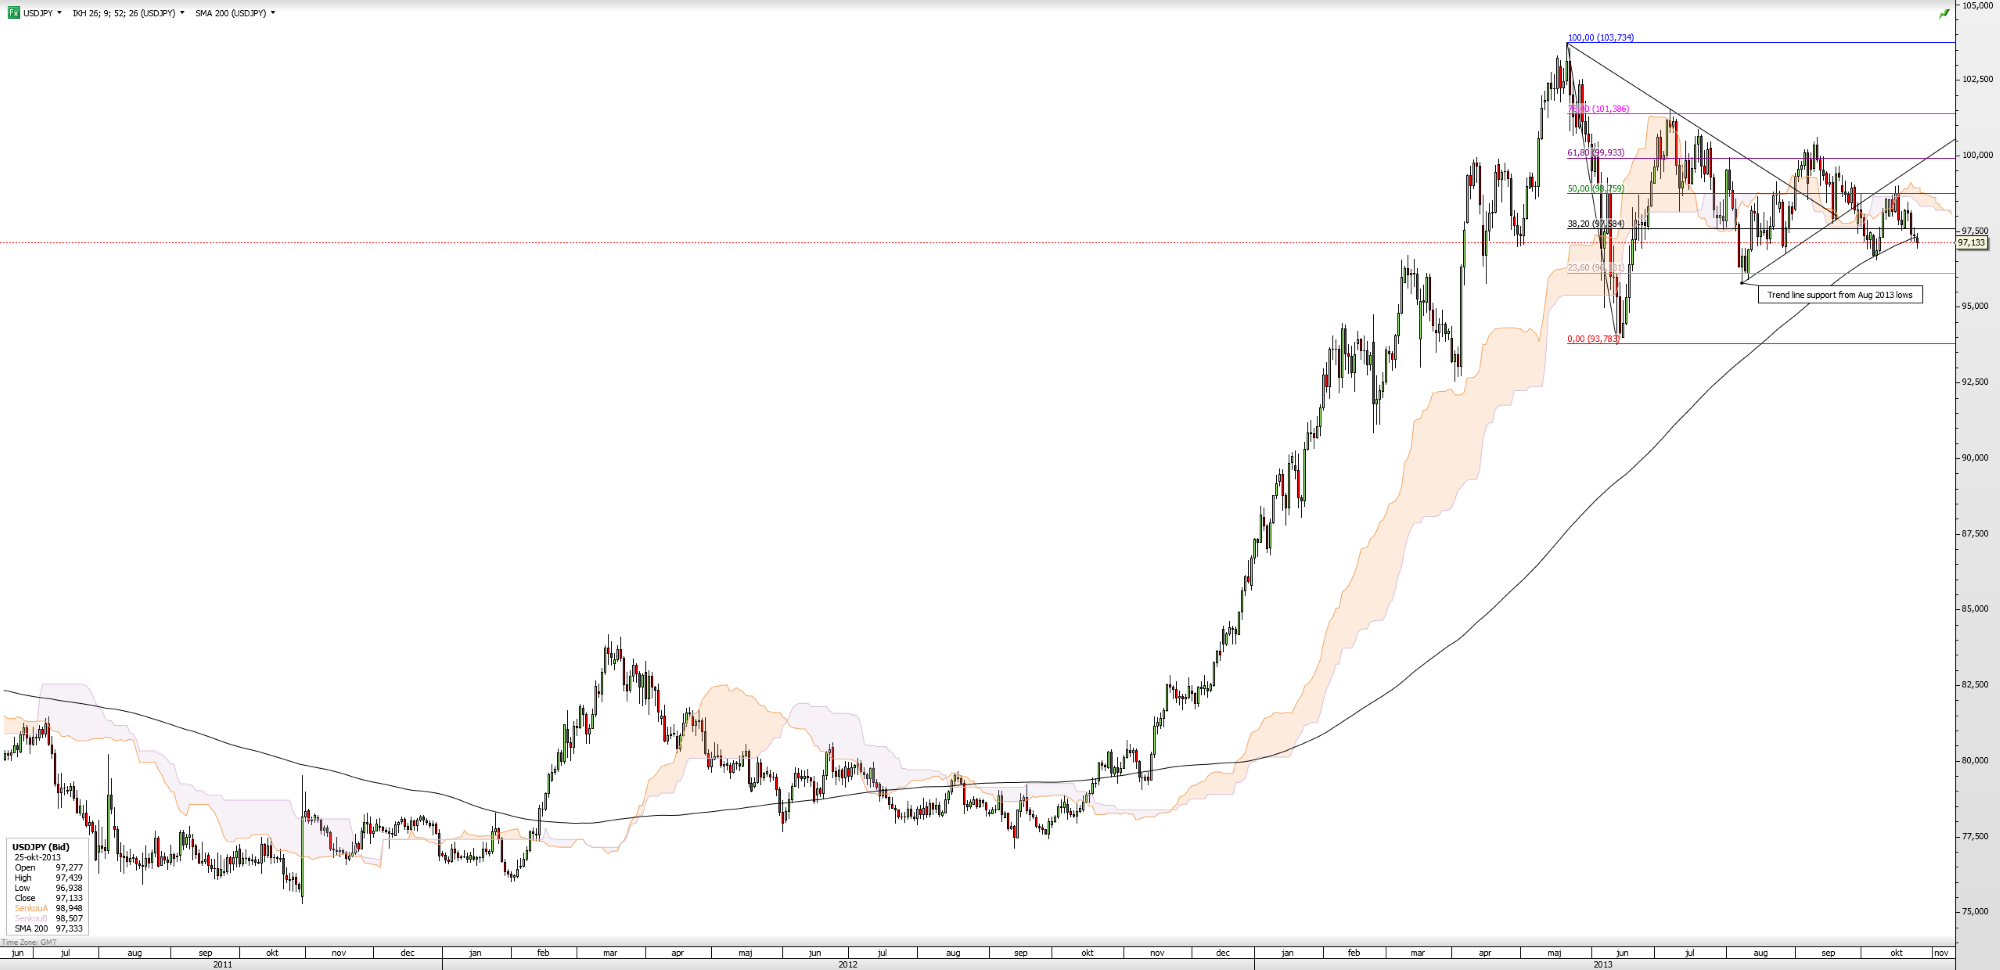
The first downside support level/target to look for is 96.56, which is the low from October 9. A close below this level would confirm the overall technical bearish bias and would give scope for a test of 95.80 in the coming trading week. To change the current bearish bias to a more neutral technical outlook, USDJPY needs to close above the highs from October 17 at 99.01.
USDJPY on a weekly scale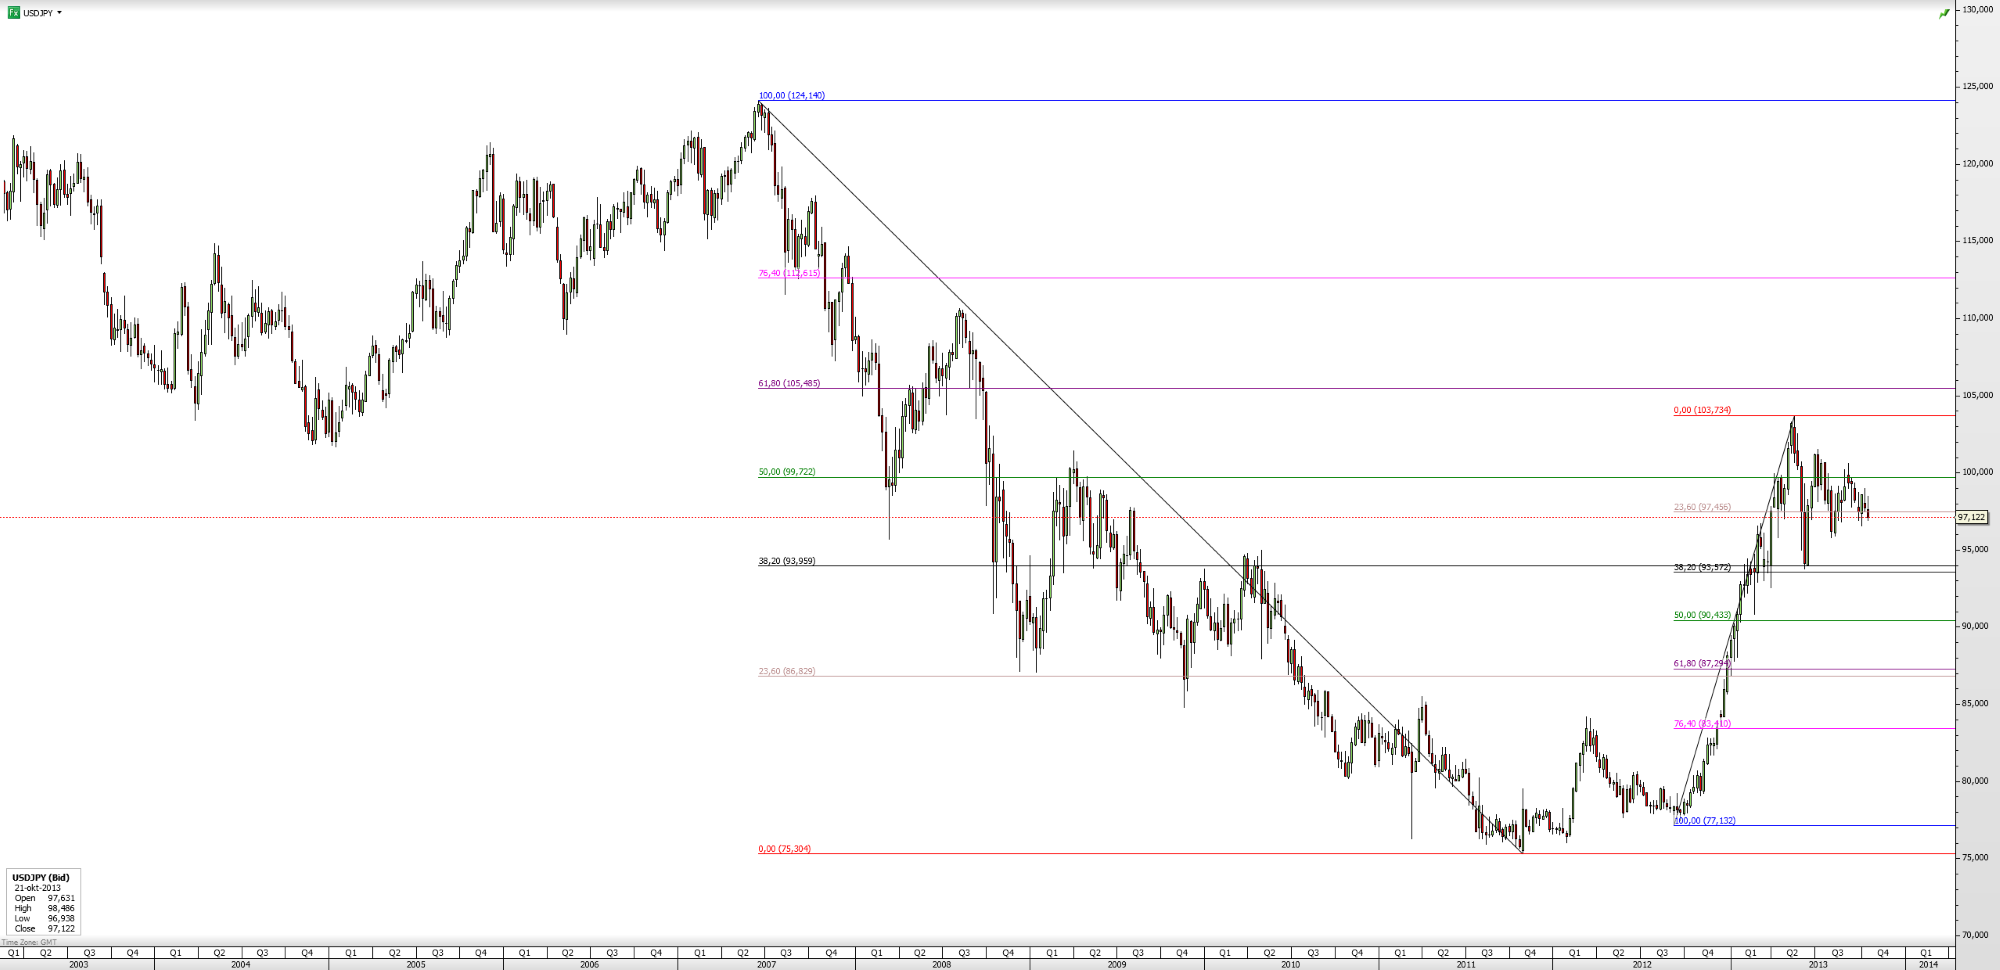
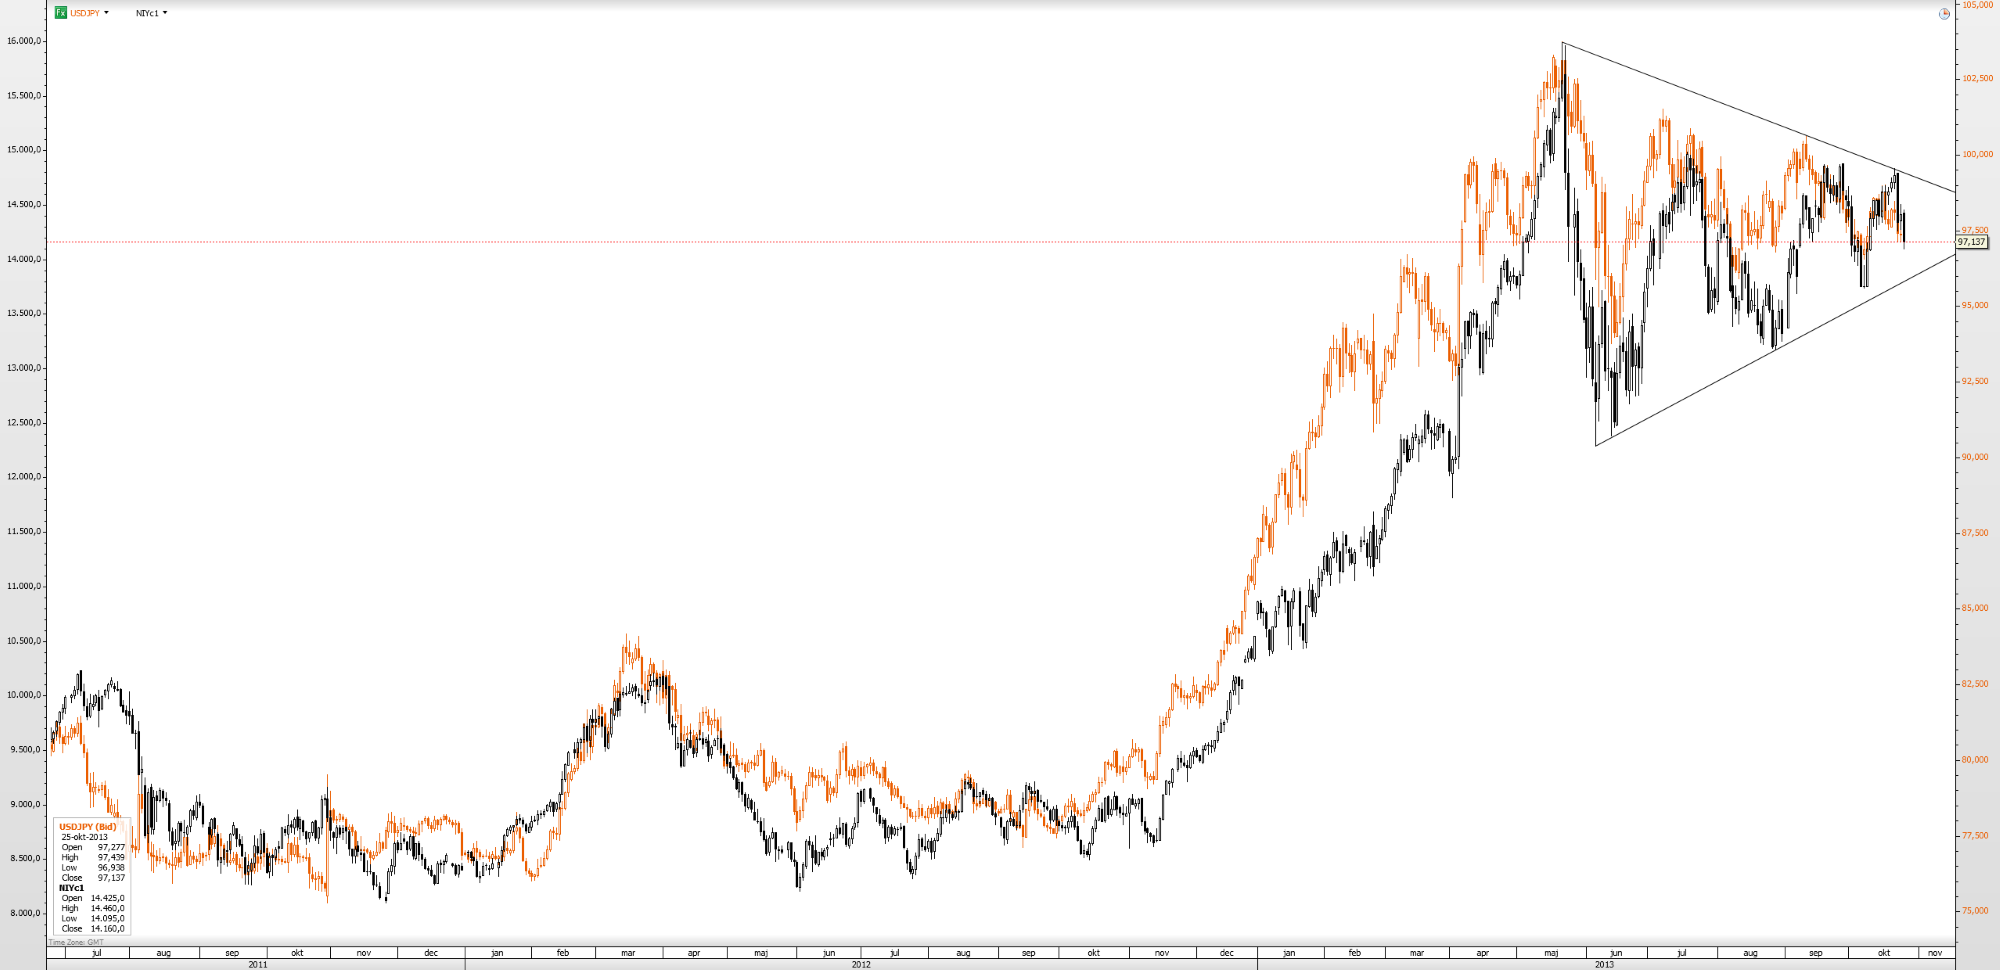
With the close correlation in the moves between Japanese stocks and the yen having shown an even closer fit in the past few weeks, we also observe the Nikkei 225 index at key support levels. While it is difficult to pinpoint which of the two is the dog and which is the the tail in this relationship, the closely fitting move lower in USDJPY as well as Japanese stocks (set against a backdrop of other major stock indices registering historical highs) gives increasing signs of a potential near-term correction looming ahead.
USDJPY Daily and Nikkei 225 arriving at key support level