January 17’ Week 3
The big traders and producers in this world are out for themselves, they are highly competitive and want to dominate the market. What they say and do are often two different things. I don’t believe much of what I read in the papers anymore, only what I see on the charts. I study trends, make pattern associations, conclude my own ideas and then bet on those ideas with full confidence. When it comes to Technical Analysis there is no guesswork, the chart is always showing the right price for right now based on the current perception of value. What I’m getting at here is that I essentially don’t need mainstream media to make my investment decisions, I don’t need a glorified twitter feed and I don’t need a biased report from an institution trading against their own recommendations.
All I need is in the chart. If a big player, or an aggregate group of traders are accumulating my system will be able to recognize it right away in the charts. I know it’s important if it has the ability to alter the current momentum; it takes a strong flow of funds to move a market and you better believe any important information that is known will be immediately executed into the Futures market before any social media or mainstream media platform knows about it.
For this reason I find it to be a moot point to look at anything other than Price Action Patterns and so the newsletter is highly geared towards identifying specific levels within the charts which a trader can monitor. The charts are often annotated along with a brief explanation of the reasoning behind the selection. Some charts may have buy/sell levels, others may just be tracking a market from one week to the next to learn how an interesting pattern will develop. The levels found in the charts are 100% original based on the mechanical trading system. It is said that your network is relative to your net worth, if you find value in this information and think others may benefit be sure to share it, I rely on your word of mouth to continue producing this content.
Closing out the first two weeks of January the newsletter locked in $4,900 per contract. Going into Week 3 we are flat, the following positions will be entered either at market or on a close outside the specified price level. Multiple markets are entered to provide diversification during the initial entry. Positions that go into the deep red with conviction are immediately closed out. Positions that lag behind are given time to work themselves out on a day by day basis. Positions that move immediately into the green are often protected by pulling up stops to lock in profits. Trades that have the ability to trend for weeks at a time have liberal stops according to higher time frame chart structure to allow larger winners to be captured.
How you manage the positions can make or break a strategy. Traders are alerted in the group chat to any stop loss modifications or profit taking as they occur. The basis of this newsletter is to provide a directional bias; I have scanned every Futures contract and have them listed in alphanumeric order below. The following charts have been selected due to the imminent or active setups in place.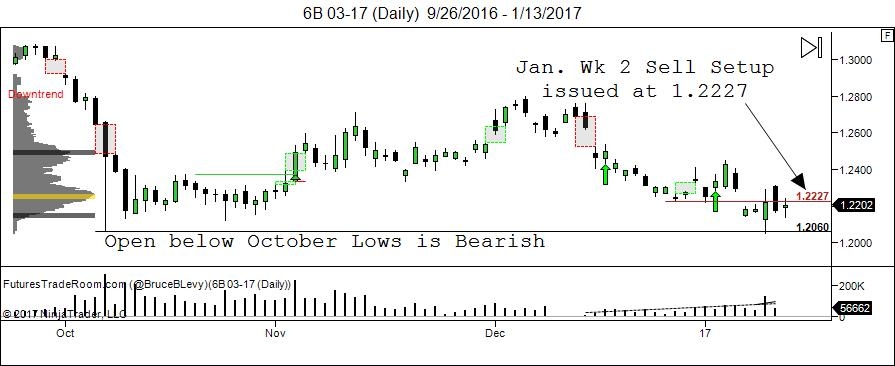
6B 03-17 (Daily)
The pound closed below last week’s sell setup signal on Thursday. It has since opened below the October lows. This is a very bearish indication as it will have a lot of trouble getting back above all the long traders looking to offset bad positions. Looking back on the Brexit vote, did you think they would leave the Euro? Most media officials could not conceive the notion of a Brexit, however in this day in age the psychology of people make it quite apparent that they want change, regardless of how it happens and the consequences. Regardless, these major events are what create long lasting trends in the currency markets.
There is a chance for mean reversion traders to come in, however we should look to short any weak retraces to the upside on a closing basis.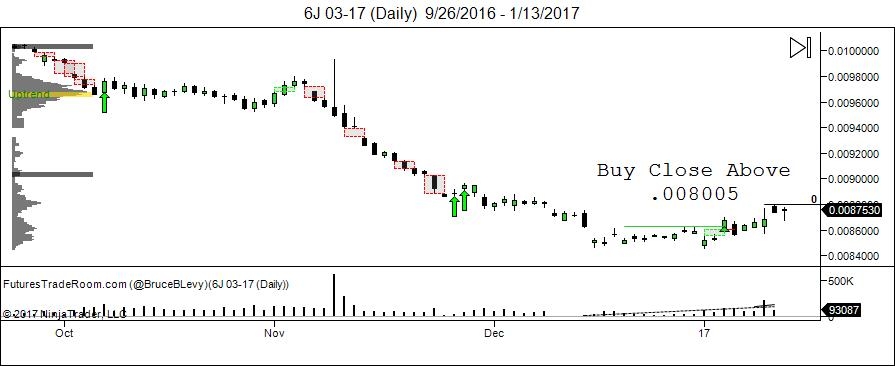
6J 03-17 (Daily)
The yen has stabilized and triggered a trend change signal. To avoid being chopped out in consolidation we want to buy a strong close above 0.0080050. Targets would be the low volume price action void in late November near 0.009000.
Newsletter will buy a close above .008005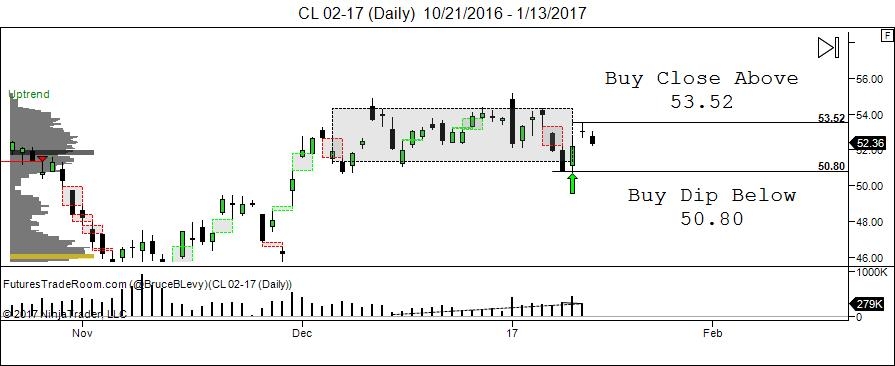
CL 02-17 (Daily)
Crude Oil has continued to consolidate and skew the profile to the upside. It is clear that demand is being met with substantial selling. In an attempt to catch Crude breaking out to targets of $70 we will want to buy closes above 53.52 on rising volume. Any intraday dips below 50.80 may be bought and held if it turns into a support test.
Newsletter will take a second day close outside either the buy or sell level indicated on the chart.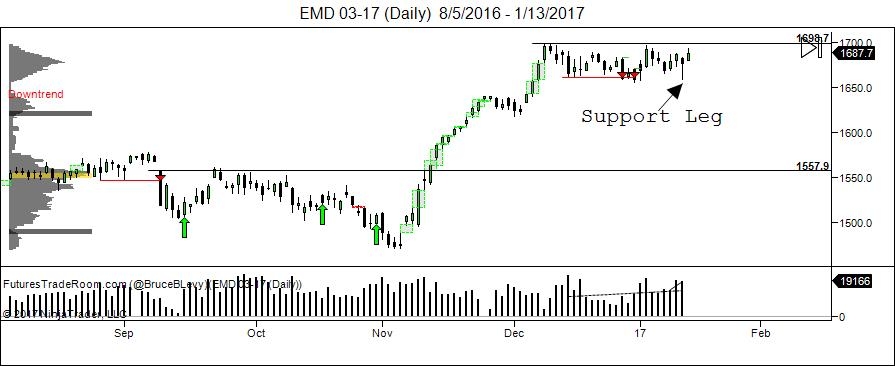
EMD 03-17 (Daily)
The Western Assets Emerging Markets Income Closed Fund (NYSE:EMD) is currently consolidating. 10 bars ago price closed above the stop and reverse marker. It has since held the level and even put in a support test to the downside. If the EMD can close above the prior consolidation it would trigger a long breakout entry.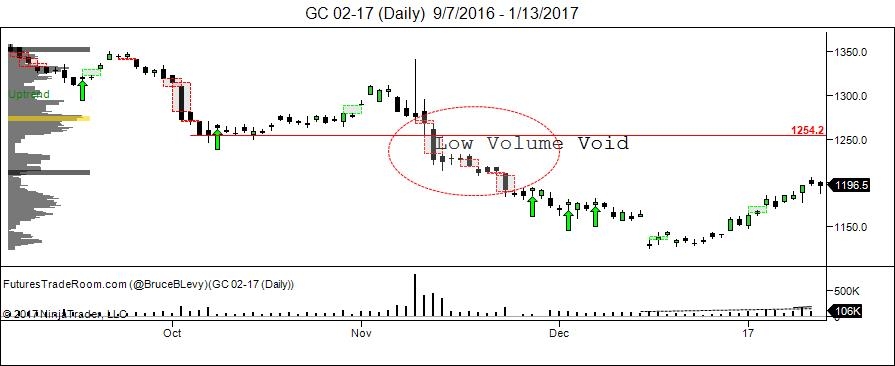
GC 02-17 (Daily)
Gold is heading into a low volume void. When price approaches these areas two things can happen.
Volume declines and price fails to penetrate the void.
Volume increase substantially and price speeds through the void, sometimes gapping along the way, in this case into prior resistance at 1254.2 I will not attempt to guess which will occur as it is too early. Volume is steadily increasing but could die off, or it could increase and close strong into the void. We will need to see a clear indication of where Gold would like to go, or if it is just simply retracing due to short covering.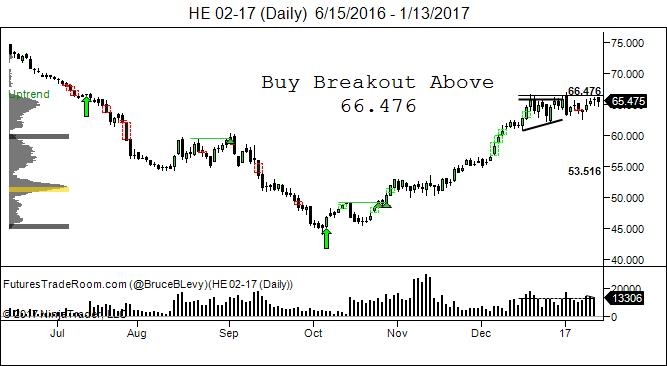
HE 02-17 (Daily)
Lean Hogs gave us a substantial run up from the original early October long signal. The current 66.47 level takes place at prior low volume void in the profile. If you look far left the price action boxes highlight low volume from the profile in early July. If we get a breakout of the current ascending triangle we will want to see how it reacts to this low volume void. Ideally it will fill the profile and close strong on the day warranting a long breakout signal.
Newsletter will get long on a decisive close above 66.47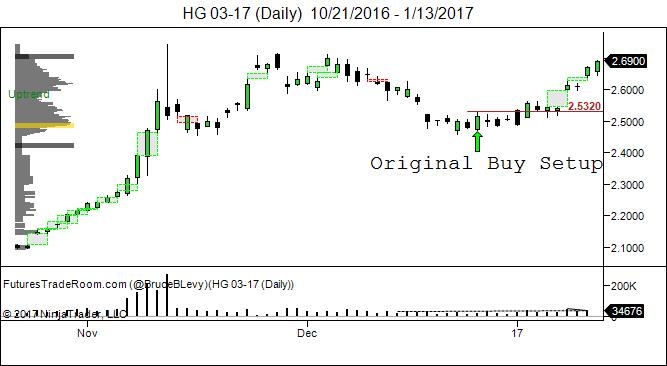
HG 03-17 (Daily)
The system originally gave us a mean reversion buy setup mid December, we issued a buy signal on a close above 2.5320. It appears that we may see a breakout in Copper above prior November highs.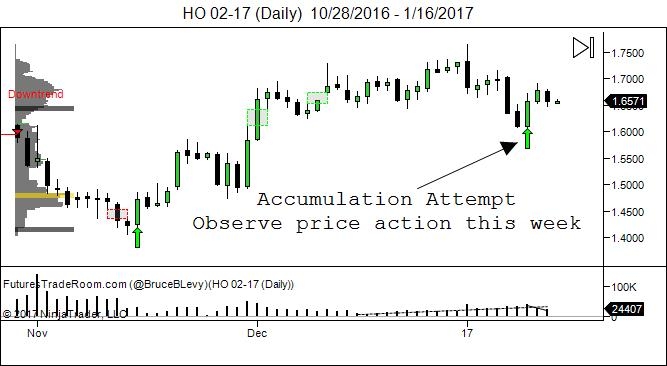
HO 02-17 (Daily)
The system has given us a second mean reversion alert on Heating Oil. It appears to be accumulation based on prior volume development. There is no signal for this chart, rather it should be watched to see how it develops over the following week. We may issue a buy signal if it holds the current levels strong for the next few days, but as far as I can tell it is overlapping in consolidation.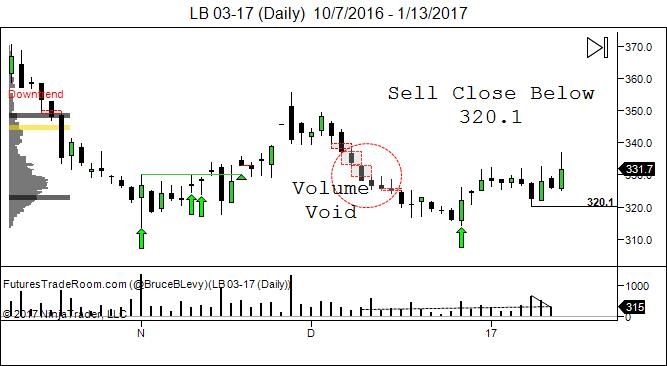
LB 03-17 (Daily)
Lumber is running to a low volume void on the profile and is showing a lack of upside interest. A close below the 320.1 swing low could create a sell setup that breaks the lows going back to early November.
Newsletter will sell close below 320.1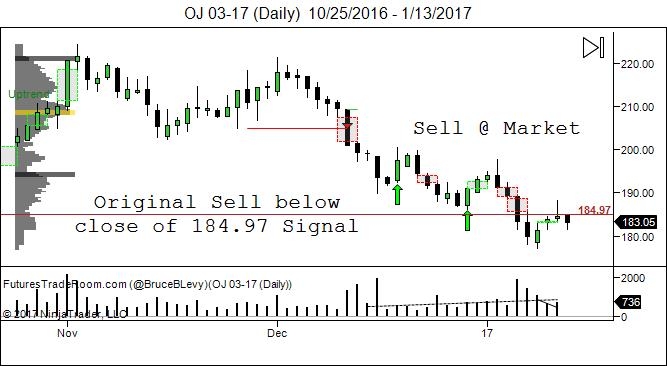
OJ 03-17 (Daily)
Orange Juice originally broke down in early December with a trend change alert signal. Two accumulation attempts were made since. We have combined the failed mean reversion with the price action void to find the 184.97 sell level. Now that OJ has rejected higher prices we can take it short as long as the overhead resistance continues to come in near 185.
Newsletter will short at Market open.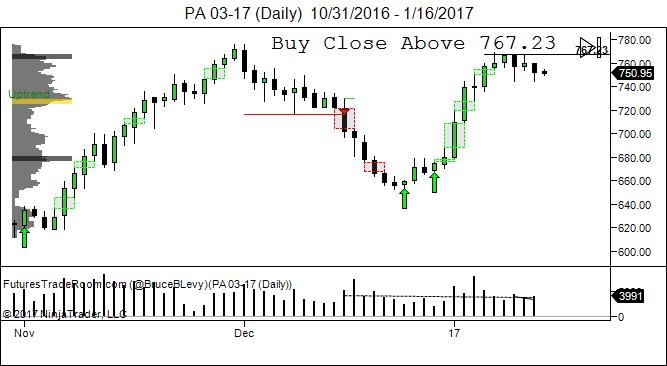
PA 03-17 (Daily)
The system has given us two mean reversion signals based on the profile for palladium in mid December. It has since gapped up leaving behind a trail of price action voids. A decisive close above 767.23 could trigger continuation above the late November highs.
Newsletter will buy a close above 767.23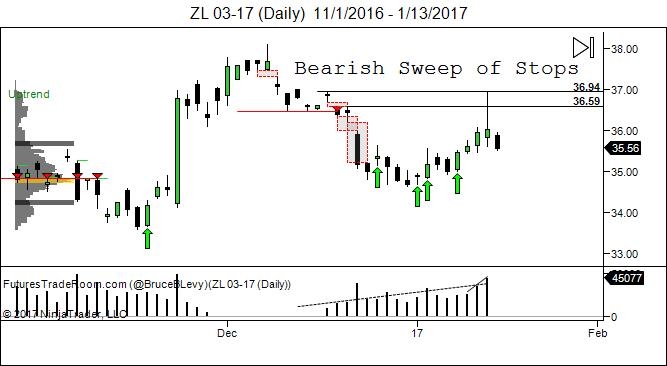
ZL 03-17 (Daily)
The signals from the system are telling us an interesting story here in Soybean Oil. In late November the first mean reversion signal was issued which resulted in a near $5 move. Next a trend change was followed by price action gaps to the downside. This tells us that those longs quickly unloaded positions and took profits as stops were triggered. Next multiple mean reversion signals indicate accumulation coupled with increasing volume on the regression line (lower volume panel). A sharp test into the low volume void was quickly rejected as short stops were taken out at 37. This inverted doji has put Soybean Oil into a range between 35 and 37. A close above 37 will lead to new highs, and a close below 35 may set a situation where price trades sideways and overlaps through all the prior heaving trading volume.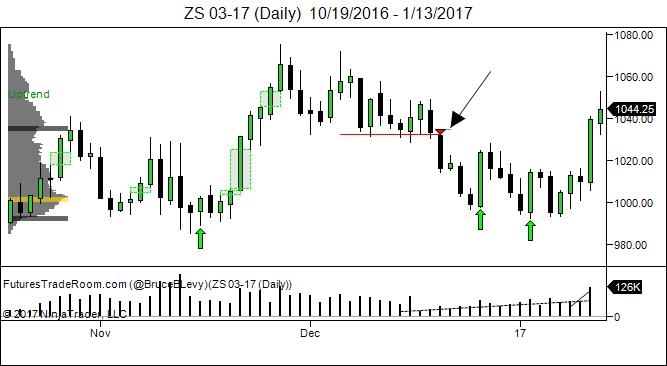
ZS 03-17 (Daily)
The system gave a long signals based on the S&R Marker on Thursday. Price should be able to eat through the prior consolidation near 1060s.
Newsletter will be long at Market.
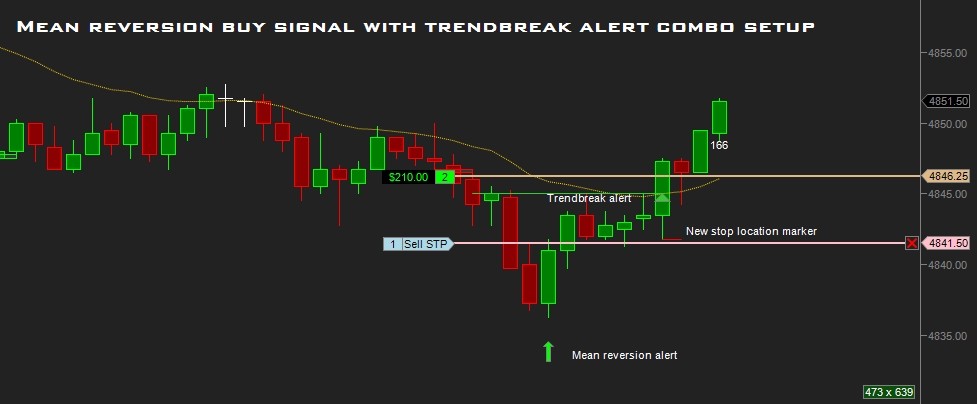
About the Mechanical Trading System The market can only do 3 things: Go up, down or sideways. Price does this by moving with value, or away from value. By understanding where the value (volume) is you can better understand how future prices will react to old levels. The Mechanical Trading System is designed to identify these changes and to alert the trader to potential setups as early as possible. The majority of the analysis found in this report comes from scanning with the mechanical trading system.
FuturesTradeRoom.com is a publisher of trading software products. Any opinions should not be considered individual investment advice. All position shown on the charts above are for Newsletter tracking purposes only and may not have been taken in a live account. For the current purposes of this newsletter assume all trades are taken in a hypothetical manner. See CFTC Rule 4.41 below.
Through use of this website viewing, using, communicating with or purchasing products/services you agree to hold www.futurestraderoom.com, its operators, owners, and any affiliates, officers, directors, employees or related person(s) harmless and to completely release them from any and all liability for any loss or damage you may incur. The information contained in our website, message board posts, videos, chats, screenshots, emails, social media, newsletters or in any other medium including and not limited to written and verbal statements should be viewed as personal opinion and is not intended to be individual investment advice, or to be relied upon as such. Online trading systems, programs, indicators, automated strategies are subject to a variety of technological problems including (but not limited to) software, hardware, and data interruptions. We are not responsible for these technological failures or delays. We are not liable for any loss or damage which may arise directly or indirectly from use of or reliance on any of our products or services.
HYPOTHETICAL PERFORMANCE DISCLAIMER CFTC RULE 4.41 HYPOTHETICAL PERFORMANCE DISCLAIMER: HYPOTHETICAL PERFORMANCE RESULTS HAVE MANY INHERENT LIMITATIONS, SOME OF WHICH ARE DESCRIBED BELOW. NO REPRESENTATION IS BEING MADE THAT ANY ACCOUNT WILL OR IS LIKELY TO ACHIEVE PROFITS OR LOSSES SIMILAR TO THOSE SHOWN; IN FACT, THERE ARE FREQUENTLY SHARP DIFFERENCES BETWEEN HYPOTHETICAL PERFORMANCE RESULTS AND THE ACTUAL RESULTS SUBSEQUENTLY ACHIEVED BY ANY PARTICULAR TRADING PROGRAM. ONE OF THE LIMITATIONS OF HYPOTHETICAL PERFORMANCE RESULTS IS THAT THEY ARE GENERALLY PREPARED WITH THE BENEFIT OF HINDSIGHT. IN ADDITION, HYPOTHETICAL TRADING DOES NOT INVOLVE FINANCIAL RISK, AND NO HYPOTHETICAL TRADING RECORD CAN COMPLETELY ACCOUNT FOR THE IMPACT OF FINANCIAL RISK OF ACTUAL TRADING. FOR EXAMPLE, THE ABILITY TO WITHSTAND LOSSES OR TO ADHERE TO A PARTICULAR TRADING PROGRAM IN SPITE OF TRADING LOSSES ARE MATERIAL POINTS WHICH CAN ALSO ADVERSELY AFFECT ACTUAL TRADING RESULTS. THERE ARE NUMEROUS OTHER FACTORS RELATED TO THE MARKETS IN GENERAL OR TO THE IMPLEMENTATION OF ANY SPECIFIC TRADING PROGRAM WHICH CANNOT BE FULLY ACCOUNTED FOR IN THE PREPARATION OF HYPOTHETICAL PERFORMANCE RESULTS AND ALL WHICH CAN ADVERSELY AFFECT TRADING RESULTS.
In the end all trades are your own to take.
