Get 40% Off
🚨 Volatile Markets? Find Hidden Gems for Serious Outperformance
Find Stocks Now

Friday Kept Week's Performance Intact; Semiconductors Strong

Published 05/29/2017, 12:06 AM
Updated 07/09/2023, 06:31 AM

Memorial Day weekend brought with it holiday style trading on Friday. It was positive finish for bulls who were able to maintain and in some cases, build on, gains from earlier in the week

Best of the action came in the Semiconductor Index which finished with a new closing high. The rally from April brought with it an acceleration in pace, comparable to the latter part of 2016. Relative performance against the NASDAQ 100 hasn't breached resistance, but it's very close. Semiconductors spent a long time in the doldrums after the 2000 peak, but they are finding their groove now.
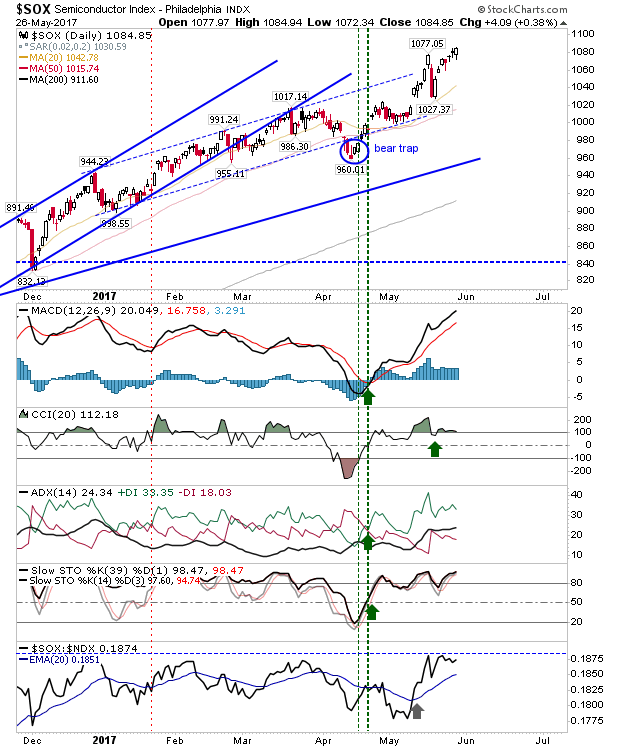
SOX Daily Chart


The S&P tagged new support and this coming week will be about consolidating itself above 2,400. Technicals are bullish with the MACD on a 'buy' trigger above the bullish zero line with an uptick in accumulation based on On-Balance-Volume and relative performance against the Russell 2000.
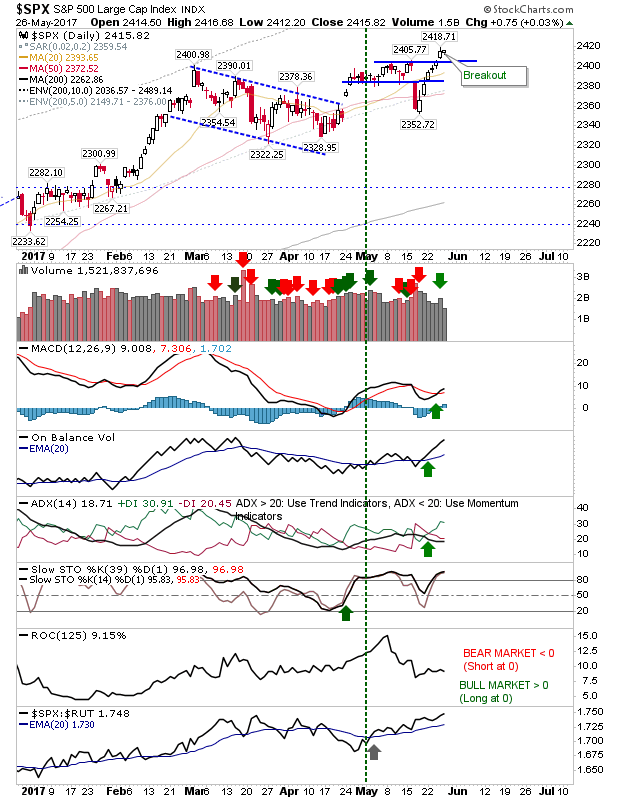
SPX Daily Chart


It was a similar story for the NASDAQ as for the S&P, except its job is to stay above 6,170. Technicals are net bullish with a good 'buy' trigger in the MACD timed with the breakout.
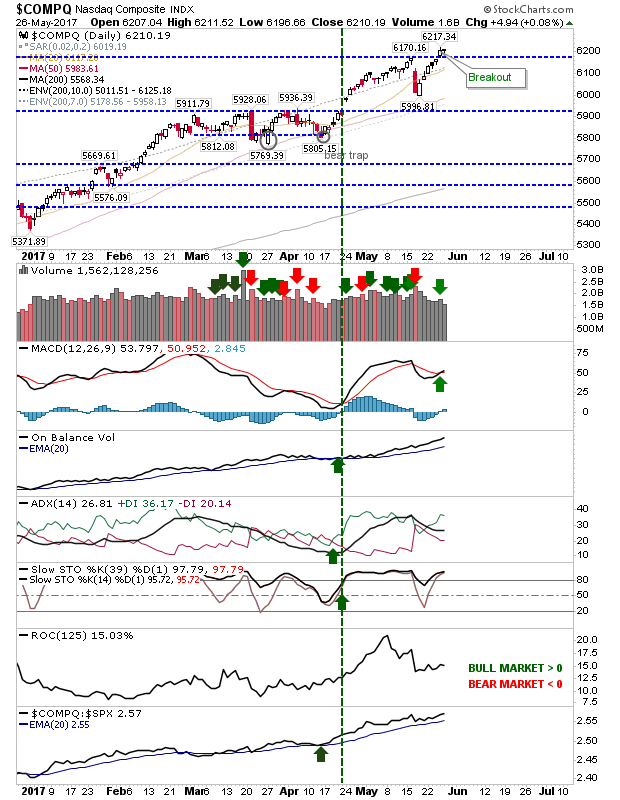
COMPQ Daily Chart


The Russell 2000 remains the ugly duckling. Flat-lined moving averages highlight the scrappy nature of recent trading. This may be an index to accumulate as a long-term buyer, but it's not one to trade.
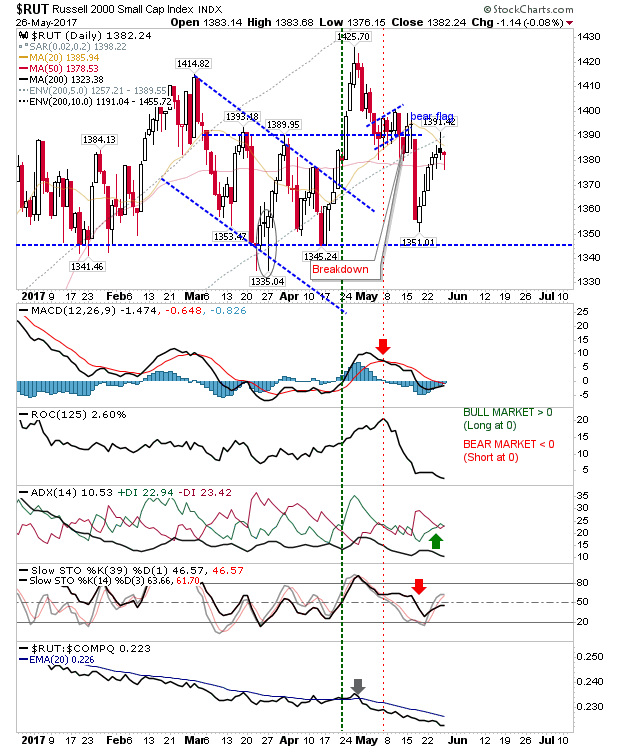
RUT Daily Chart


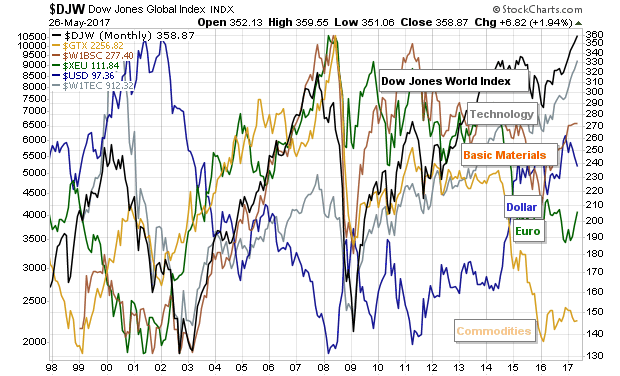
The last chart is one for long-term buyers. It has been clear from 2014 through to today that commodities have underperformed, but this means value opportunities for those willing to look past current struggles. Remember, this is a monthly chart of the Dow Jones Global Index so don't be looking at the day-to-day machinations, instead, aim to build positions over time in commodities and equities with heavy commodity exposure.
3rd party Ad. Not an offer or recommendation by Investing.com. See disclosure here or remove ads .

Monthly DJW:GTX:W1B5C:XEU:USD:W1TEC 1998-2017

Latest comments

Risk Disclosure: Trading in financial instruments and/or cryptocurrencies involves high risks including the risk of losing some, or all, of your investment amount, and may not be suitable for all investors. Prices of cryptocurrencies are extremely volatile and may be affected by external factors such as financial, regulatory or political events. Trading on margin increases the financial risks.
Before deciding to trade in financial instrument or cryptocurrencies you should be fully informed of the risks and costs associated with trading the financial markets, carefully consider your investment objectives, level of experience, and risk appetite, and seek professional advice where needed.
Fusion Media would like to remind you that the data contained in this website is not necessarily real-time nor accurate. The data and prices on the website are not necessarily provided by any market or exchange, but may be provided by market makers, and so prices may not be accurate and may differ from the actual price at any given market, meaning prices are indicative and not appropriate for trading purposes. Fusion Media and any provider of the data contained in this website will not accept liability for any loss or damage as a result of your trading, or your reliance on the information contained within this website.
It is prohibited to use, store, reproduce, display, modify, transmit or distribute the data contained in this website without the explicit prior written permission of Fusion Media and/or the data provider. All intellectual property rights are reserved by the providers and/or the exchange providing the data contained in this website.
Fusion Media may be compensated by the advertisers that appear on the website, based on your interaction with the advertisements or advertisers.
© 2007-2024 - Fusion Media Limited. All Rights Reserved.