S&P 500 at 8,000, gold at $5,400, Tesla to double: Here are top trades for 2026

Fossil Group Inc. (NASDAQ:FOSL) reported third-quarter 2017 results, wherein the top and bottom line plummeted year over year but beat the Zacks Consensus Estimate. The company’s performance was negatively impacted by sluggish traditional watch business and persistent weakness in the leather and jewelry categories. Further, management slashed guidance for 2017 in response to the weak results, consequently impacting investor sentiment.
Evidently, shares of Fossil Group declined 10.4% during after-hours trading on Nov 7. We note that Fossil Group has been delivering sluggish results for quite some time, which is reflected in its share price history. The company’s shares have plunged 74.8% in the past year compared with the industry’s decline of 28.5%.
Q3 Earnings
Adjusted earnings were 4 cents per share in the quarter which compared favorably with the Zacks Consensus Estimate of a loss of 14 cents. However, the bottom line declined significantly from 48 cents reported in the year-ago period. The slump can be attributed to lower sales and margins.
On a GAAP basis, the company reported a loss of 11 cents. We note that during the quarter, Fossil Group gained 2 cents from favorable foreign currency movements.
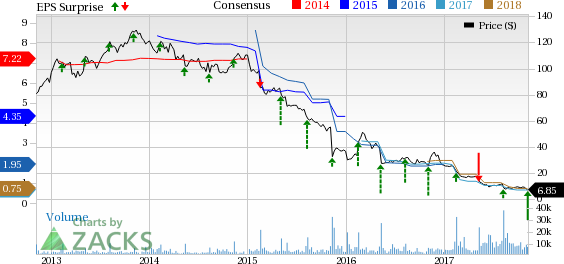
Fossil Group, Inc. Price, Consensus and EPS Surprise
Quarter in Detail
Net sales of $688.7 million surpassed the Zacks Consensus Estimate of $653.2 million. Though connected watches boosted sales, overall net sales declined 6.7% from the prior-year quarter, primarily due to sluggishness in the company's traditional watch portfolio. On a constant-currency basis, sales declined 8% during the quarter. Underlying weakness in the company’s leather and jewelry businesses also marred the top-line performance during the quarter.
Global retail comps, including e-commerce, dropped 6% year over year, with softness across all categories and geographies.
Gross profit tumbled 16.9% to $319.9 million. Gross margin contracted 580 basis points (bps) to 46.4% due to lower margins from connected products and increased product valuation charges. Lower retail margins stemming from greater promotional activity, unfavorable currency impacts and increased off-price sales also dragged the gross margin. These downsides were partly compensated by margin improvement owing to the New World Fossil initiative.
For the third quarter, the company’s operating loss amounted to $0.5 million, as against the operating income of $31.2 million in the prior-year quarter. This can be attributed to lower sales and gross profit, despite lower operating expenses.
Performance Based on Business Categories
Category-wise, sales in the watches segment declined 2.7% (down 4% on constant-currency basis) to $551.9 million in the quarter. Fossil Group has been struggling with its watch category for quite some time now. Management noted that higher demand for tech-enabled watches has been denting traditional watch sales. Though the company has been expanding its smartwatches and wearable portfolio, these efforts are yet to revive results.
Sales at Jewelry and leather businesses also went down 20.8% (down 23% on constant-currency basis) to $47.7 million and 18.9% (down 20% on constant-currency basis) to $75.7 million, respectively. Notably the sales of leather products have been unimpressive on account of unfavorable consumer response.
Region-Wise Performance
Region-wise, sales slumped 14.7% (down 15% on a constant currency basis) in Americas to $308.1 million owing to sales decline in the United States and sluggish performance of traditional watches. This was marginally offset by sales growth in connected watches. The region also witnessed weakness in the leather and jewelry businesses.
Sales increased 1.6% in Europe (down 2% on a constant-currency basis) to $247.2 million. Sales in the region benefitted from fourth-quarter early deliveries. However, sales growth in the U.K was countered by decline in the Middle East.
Net sales from Asia declined 0.1% (flat on a constant-currency basis) to $133.4 million. Sales growth was mainly witnessed in India and China, countered by dismal performance from all other regions.

Other Updates
At the end of the quarter, the company had cash and cash equivalents of $166.9 million, long-term debt of $444.3 million and shareholders’ equity of $653 million.
Since the prior-year quarter, the company has undertaken several store closures. At the end of the third quarter of 2017, the company’s total store count was 556 compared with 610 stores in the year-ago period.
Outlook
For 2017, Fossil Group expects net sales to decline in the range of 8.5-10.5%, comparatively wider than the previously estimated decline of 4.5-8.5%. The company expects adjusted operating margin growth in the range of flat to up 1.3%. Further, it projects 2017 adjusted earnings in the range of a loss of 45 cents to earnings of 10 cents. The revised guidance is considerably lower than the prior earnings estimation of 35 cents to $1.15.
For fourth-quarter 2017, the company expects net sales to decrease in the range of 11-3.5%. Adjusted operating margin growth is anticipated in the range of 1.8-5.5%. Consequently, Fossil Group expects adjusted earnings in the range of 10-65 cents per share.
Fossil Group continues to expect a challenging retail environment for its traditional watch category. However, this Zacks Rank #3 (Hold) company anticipates considerable growth opportunities in the connected wearables business and plans to continue investing in the same. It also remains on track with New World Fossil initiative which has been aiding cost reduction and inducing efficiency in its operations.
Stocks to Consider
Investors may consider other stocks from the same sector such as Burlington Stores, Inc. (NYSE:BURL) , Home Depot Inc (NYSE:HD) and Kohl's Corporation (NYSE:KSS) . All these stocks carry a Zacks Rank #2 (Buy). You can see the complete list of today’s Zacks Rank #1 (Strong Buy) stocks here.
Burlington Stores delivered an average positive earnings surprise of 17.7% in the trailing four quarters. It has a long-term earnings growth rate of 17.4%.
Home Depot delivered an average positive earnings surprise of 3.7% % in the trailing four quarters. It has a long-term earnings growth rate of 13.5%.
Kohl's Corporation delivered an average positive earnings surprise of 18% in the trailing four quarters. It has a long-term earnings growth rate of 5.7%.
Wall Street’s Next Amazon (NASDAQ:AMZN)
Zacks EVP Kevin Matras believes this familiar stock has only just begun its climb to become one of the greatest investments of all time. It’s a once-in-a-generation opportunity to invest in pure genius.
Home Depot, Inc. (The) (HD): Free Stock Analysis Report
Fossil Group, Inc. (FOSL): Free Stock Analysis Report
Burlington Stores, Inc. (BURL): Free Stock Analysis Report
Kohl's Corporation (KSS): Free Stock Analysis Report
Original post
Zacks Investment Research