The Top 10 of the Ranking and Rating list for the coming week shows the following stronger currencies being well represented for going long: the AUD(4X) with the CAD(4X) . The weaker currencies are the USD(4X) followed by the JPY(2X) and the CHF(2X).
By diversifying a nice combination can be traded in the coming week like e.g.:
Ranking and Rating list
Analysis based on TA charts for all the major currency pairs. Good luck to all. No advice, just info. Every week the Forex ranking rating list will be prepared for the weekend. All the relevant Time Frames will be analyzed and the ATR and Pip value will be set.
For analyzing the best pairs to trade looking from a longer-term perspective the last 13 weeks Currency Classification can be used in support.
This was updated on 2 July 2017 and is provided here for reference purposes:
Strong: EUR, NZD and CHF. The preferred range is from 6 to 8.
Neutral: GBP, USD and JPY. The preferred range is from 3 to 5.
Weak: AUD, CAD. The preferred range is from 1 to 2.
When comparing the 13 weeks Currency Classification with the pairs mentioned in the Ranking List above some would then become less interesting. On the other hand, these pairs are at the top of the list partly also because of their volatility. It seems best to take positions for a short period then and take advantage of the high price movements.
With the FxTaTrader Strategy, these pairs are not traded because these would be trades in the 4 Hour chart or in a lower Time Frame. Nevertheless, they may offer good chances for the short term trader.
Currency Score Chart
The Currency Score analysis is one of the parameters used for the Ranking and Rating list which is published also in this article. The Currency Score is my analysis on the 8 major currencies based on the technical analysis charts using the MACD and Ichimoku indicator on 4 Time Frames: the monthly, weekly, daily and 4 hours. The result of the technical analysis is the screenshot here below.

When comparing the 13 weeks Currency Classification with the recent Currency Score, as provided in the image above, we can determine the deviations. In the article "Forex Strength and Comparison" this is analyzed in more detail.
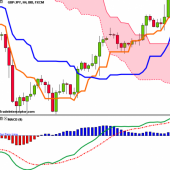
Chart of the Week
The Chart for this week is the USD/CAD Daily chart.
Price is clearly in a downtrend and trading on pullback may offer a good opportunity.
The PSAR changed last Friday and is confirming a continuation of the downtrend.
The next pullback could be around the Tenkan-Sen which is currently at 1.28291.
Just above that was a consolidation area with two Fractals (purple arrows) holding the price for a while from going down.
In the case of a pullback, the MACD will also recover around the Signal line.
Once the pullback has taken place the 4H. chart may offer good information for the entry price.
- This is a pair that fits best in Point 3 of the Comparison Table Guide which you can also read here below.
- Third, only Neutral currencies are Approved against a better-classified currency when there is a Currency Score difference of at least 4. In the case of a currency worse classified, the Currency Score difference has to be at least -4.
The above-mentioned situations applicable to this point may happen when there is a clear reversal and the chart is showing a new trend with good entries in the new direction. The difference between point 3 and the previous 2 points is that with point 3 a reversal in the whole market is possible when looking at all the currencies together. This gives a better chance when a trend reversal takes place compared to point 1 and 2! - The reversal mentioned here above is seen from a longer-term. In the short term, the trend is down as can be seen in the Daily chart.
- The CAD is a weak currency and the USD a neutral currency. The Currency Score Difference is -6 so the strength of the reversal is strong.
For more information about the "Comparison Table Guide" read my other Weekly article called the "Forex Strength and Comparison".
Besides this article, I also use the Forex "Strength and Comparison" which is also available once a week on my blog. In that article, we look in more detail at the relative position of the currencies and pairs. We will look in more detail at the interesting pairs from a longer term perspective for trading in the Daily and Weekly chart. We will use the information from this article, "Ranking, Rating and Score", and analyze it further in more detail.
It is recommended to read the page "Currency score explained", "Introduction to the FxTaTrader Forex Models" and "Statistics and Probabilities" for a better understanding of the article. If you would like to use this article, then mention the source by providing the URL FxTaTrader.com or the direct link to this article. Good luck in the coming week.
DISCLAIMER: The articles are my personal opinion, not recommendations, FX trading is risky and not suitable for everyone.The content is for educational purposes only and is aimed solely for the use by ‘experienced’ traders in the FOREX market as the contents are intended to be understood by professional users who are fully aware of the inherent risks in forex trading. The content is for 'Forex Trading Journal' purpose only. Nothing should be construed as a recommendation to purchase any financial instruments. The choice and risk are always yours.