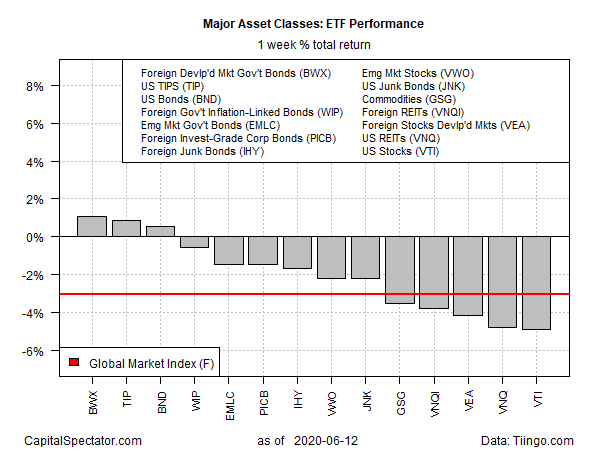
Government bonds in foreign developed markets extended a rally last week as risk-off sentiment revived. This slice of global fixed-income posted the strongest performance for the major asset classes over the trading week through Friday, June 12, based on a set of exchange-traded funds.
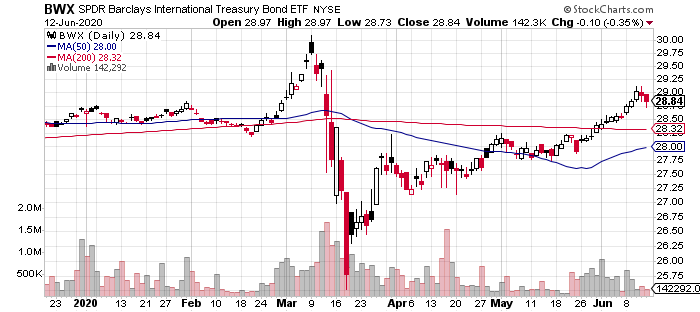
SPDR® Bloomberg Barclays International Treasury Bond ETF (NYSE:BWX) led the field with a 1.1% return last week—the fourth straight weekly advance for the fund. The combination of risk-off sentiment and a weaker dollar in recent history has been a boon for BWX, which ended the week near a three-month high.

US bonds were on BWX’s heels last week as the strongest gainers, driven by renewed demand for safety. “There is a full realization that short of a vaccine, this is going to be a longer haul than many had expected — with the hopes of a V-shaped recovery now thrown out the window,” says Raymond James' chief fixed-income strategist Kevin Giddis .
The biggest set-back for the major asset classes unfolded in US equities. Vanguard Total Stock Market Index (NYSE:VTI) slumped 4.9%, marking the fund’s first weekly decline in a month.
Stock traders will be keenly following this week’s actions amid renewed worries about a second wave of coronavirus infections.
James Athey, a money manager at Aberdeen Standard Investments, says:
“Any further sell off from here will likely see some larger unwinds of the more price and momentum driven investment styles."
“People will then start openly asking the question again, ‘Was that just a huge bear market rally?’”
For the major asset classes overall, the trend last week turned negative for the first time in four weeks, based on the Global Markets Index (GMI.F). This unmanaged benchmark, which holds all the major asset classes (except cash) in market-value weights via ETFs, fell 3.1%–GMI.F’s biggest weekly setback since March.

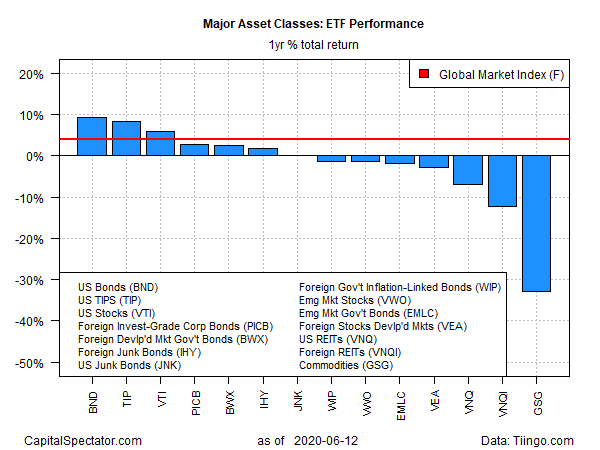
For the one-year trend, a broad measure of US investment-grade bonds are holding on to first place. Vanguard Total Bond Market Index Fund (NASDAQ:BND) is up 9.5% on a total return basis.
Meantime, the deepest loss for the major asset classes continues to be found in broadly defined commodities. The iShares S&P GSCI Commodity-Indexed Trust (NYSE:GSG) was in the red by nearly 32% for the trailing one-year window at the close of last week’s trading.
GMI.F, by contrast, is still up by a moderate 3.9% for the year as of Friday’s close.

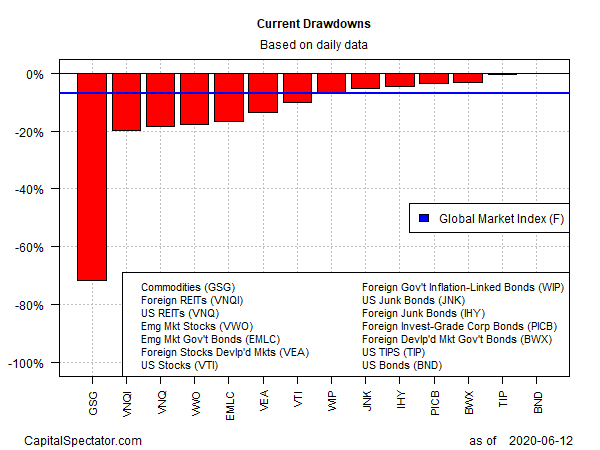
Ranking asset classes via current drawdown continues to show a wide range of results, ranging from a near-72% peak-to-trough decline for commodities (GSG) to the fractional drawdown for US investment-grade bonds (BND).
For comparison, GMI.F’s current drawdown is currently -6.9%.

