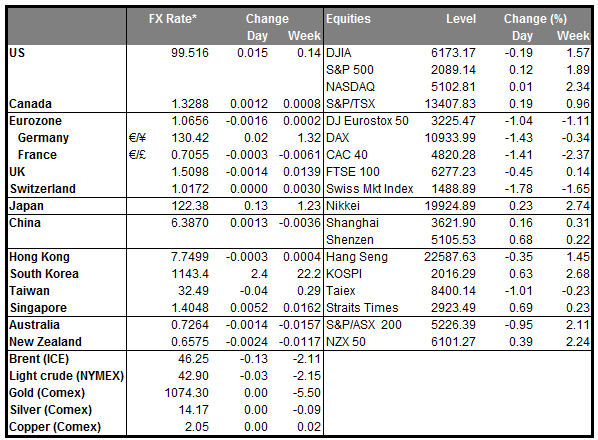
• Fed’s Kaplan: four rate hikes are “not baked in the cake” Dallas Fed President Rober Kaplan said that four rate hikes in 2016 are “not baked in the cake”. Fed officials overall expect four rate hikes this year, according to the median of their forecasts from December. The global stock market volatility and concerns about slowing growth in China have forced the Fed to hold of raising rates before. As such this could happen again if the stock market turmoil continues and China’s slowdown don’t stabilize anytime soon. Nevertheless, the Fed official said that it was too soon to tell if the situation over China will get worse or if in few months the nation will rebound. Investors are now focused on when the next rate hike will be, with end of January being too soon as the Fed will not get enough economic data since their last meeting to justify a rate rise. Between now and March however, there might be sufficient data to warrant a rate hike. As we have noted several times, USD remains data driven, and strong data are needed to keep the greenback on a rising mode.
• Crude Oil prices tumbled more than 5% on Monday Crude oil prices plunged yesterday to trade just above USD 30 pb. A world-wide glut of crude oil and worries about emerging-market demand have kept the price of oil down, and market participants now expect the price of oil to break below USD 30 and test the USD 20 zone. China’s slowdown along with the fact that drillers won’t quit pumping despite the oil glut are likely to keep oil under selling pressure, in our view.
• Today’s highlights: During the European day, the main event will be the UK industrial production for November. Expectations are for the industrial output to have remained flat after rising 0.1% mom in October. The construction and manufacturing PMIs for the same month were not particularly encouraging. Neither was the Q4 Economic Survey by the British Chamber of Commerce, which described most manufacturing sector key balances as being weaker in Q4 than in Q3. For these reasons, we see an increased likelihood for a soft industrial production figure as well. This could weaken GBP at the release.
• From the US, we get only secondary importance data. The NFIB small Business Optimism Index for December is coming out. Even though this indicator is not a major market mover, it is worth watching it due to the Fed’s emphasis on employment, as small businesses employ the majority of people in the US. Additionally, the Job Opening and Labor Turnover Survey (JOLTS) report for November is due to be released. This survey will also report the “quit rate”, which measures workers who voluntarily resign, and is a closely watched indicator of how strong the job market is. Following the better-than-expected NFP figure for December, these indicators could add to evidence that the US jobs market is on a solid ground.
• We have several speakers on Tuesday’s agenda: Fed Vice-Chair Stanley Fischer, and Richmond Fed President Jeffrey Lacker speak. ECB Executive Board member Villeroy de Galhau, ECB Executive Board member Peter Praet, ECB Executive Board member Jens Weidman and ECB Executive Board member Sabine Lautenschlaeger speak. Bank of Japan Governor Haruhiko Kuroda and Bank of England Governor Mark Carney also speak.
The Market
EUR/USD hits support slightly below 1.0850
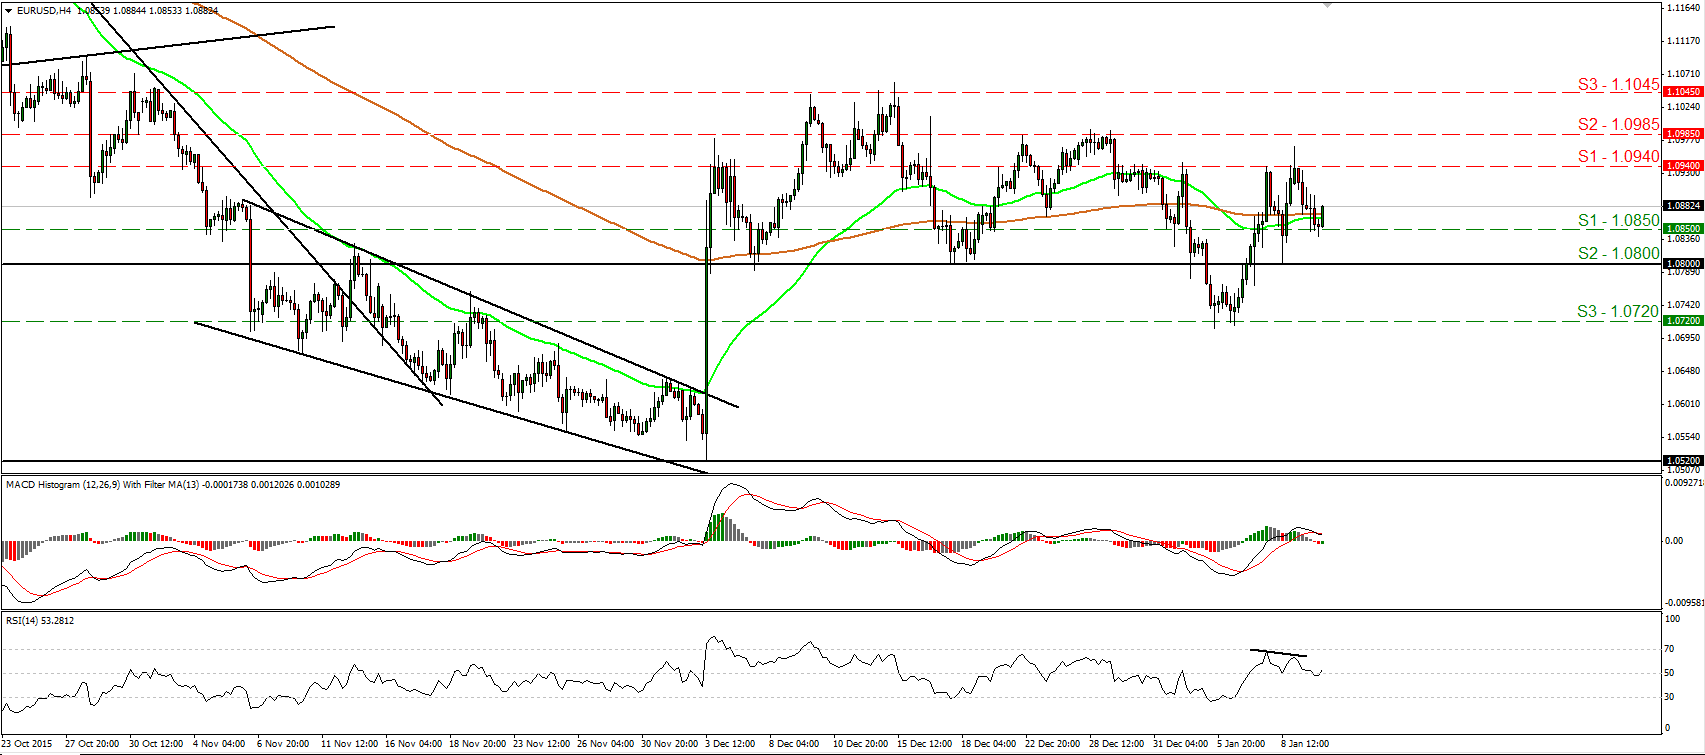
• EUR/USD tumbled on Monday, but the decline was stopped slightly below the 1.0850 (S1) support barrier and then, the rate rebounded somewhat. Taking into account that the rate remains above the 1.0800 (S2) key support hurdle, I prefer to maintain a “wait and see” stance for now with regards to the short-term outlook. I would like to see another dip below 1.0800 (S2) before turning my eyes back to the downside. Looking at our momentum studies, I see that the RSI rebounded from near its 50 line, while the MACD, although positive, has topped and fallen below its signal line. These mixed sings support my view to stay flat for now. Switching to the daily chart, I see that the 1.0800 (S2) key hurdle is the lower bound of the range the pair had been trading from the last days of April until the 6th of November. I also see that on the 7th and 17th of December, the rate rebounded from that zone. Therefore, the fact that the rate is trading above the 1.0800 (S2) zone makes me stay flat as far as the medium-term picture is concerned as well.
• Support: 1.0850 (S1), 1.0800 (S2), 1.0720 (S3)
• Resistance: 1.0940 (R1), 1.0985 (R2), 1.1045 (R3)
GBP/JPY appears ready for another dip below 170.00
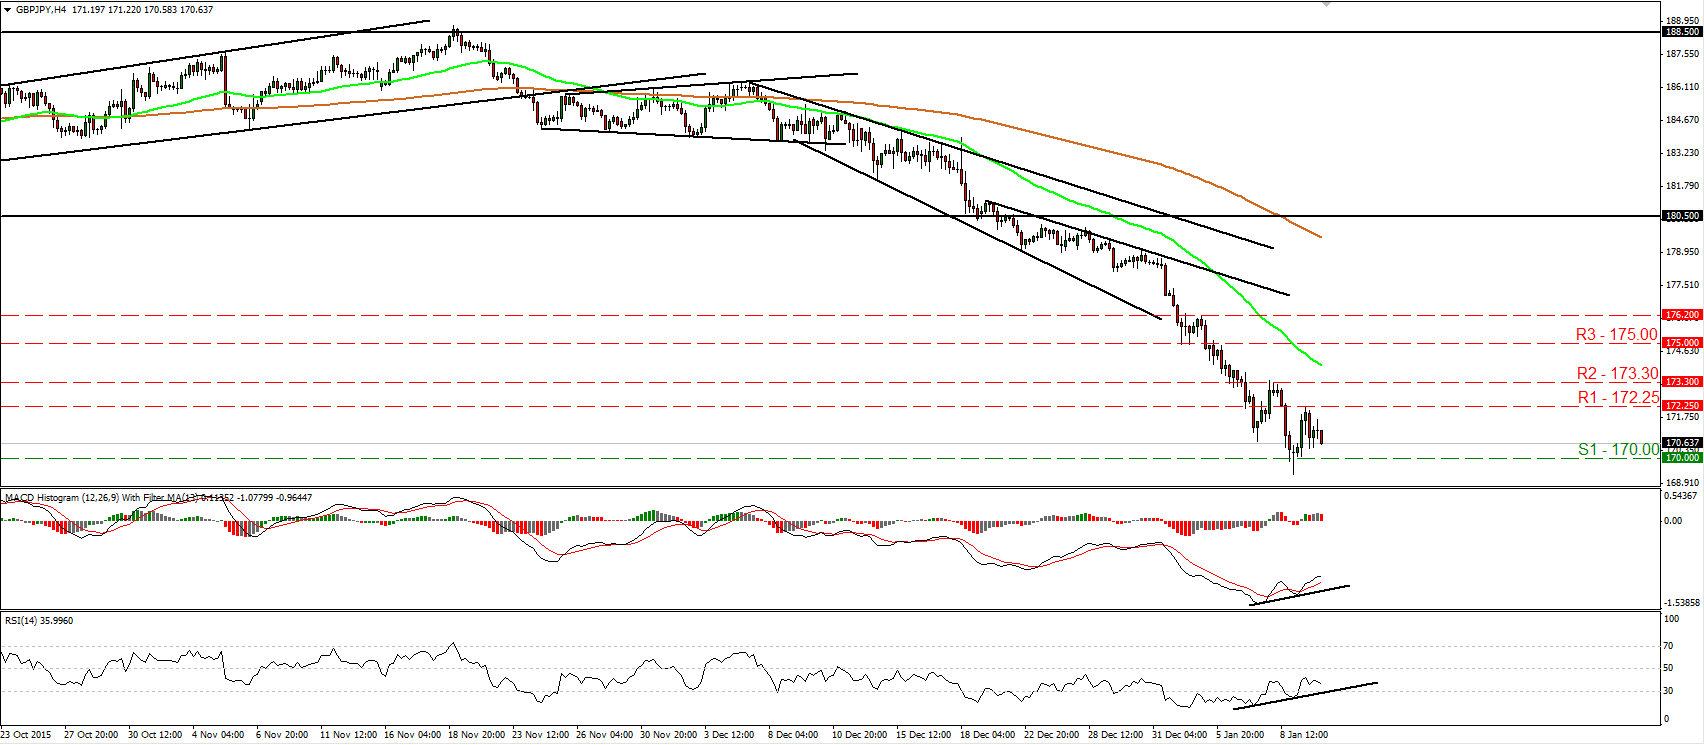
• GBP/JPY edged down after it hit resistance at 172.25 (R1). The short-term trend remains a downtrend and as a result I would expect another dip below the psychological zone of 170.00 (S1) to open the way for the 169.00 (S2) zone. Looking at our momentum studies, I see that the RSI stands below 50 and turned down again, while the MACD, already negative, shows signs of topping as well. However, there is positive divergence between both these indicators and the price action, which reveals decelerating downside speed. Zooming out to the daily chart, I see that on the 21st of December the rate fell below the 180.50 key hurdle, which is the lower bound of the wide range the pair had been trading since the 25th of August. Bearing that and the decisive dip below the psychological zone of 175.00 (R2), I would see a negative medium-term picture as well.
• Support: 170.00 (S1), 169.00 (S2), 168.00 (S3)
• Resistance: 172.25 (R1), 173.30 (R2), 175.00 (R3)
AUD/USD slides after hitting 0.7025
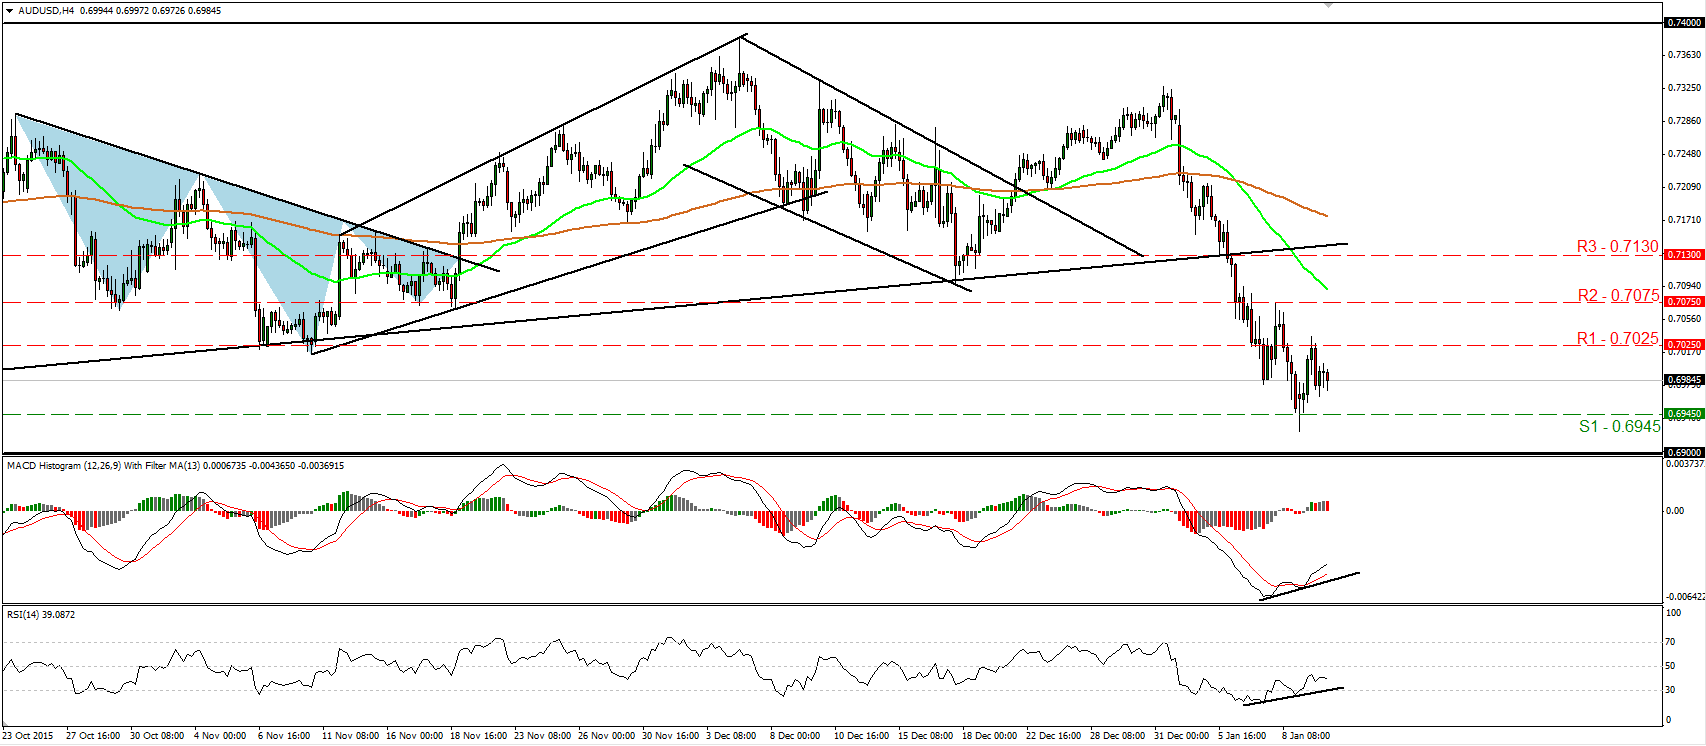
• AUD/USD slid yesterday after it found resistance near the 0.7025 (R1) resistance zone. The price structure on the 4-hour chart still suggests a short-term downtrend and therefore, I would expect the bears to regain their momentum at some point and aim for another test at the 0.6945 (S1) support zone. A decisive dip below that support could set the stage for extensions towards the 0.6900 (S2) key obstacle. Taking a look at our short-term oscillators though, I see signs that another corrective bounce could be on the cards before sellers decide to pull the trigger again. The RSI edged higher after it exited its below-30 zone, while the MACD, although negative, stands above its trigger line and points up. What is more, there is positive divergence between both these indicators and the price action. On the daily chart, I see that AUD/USD remains within a range between 0.6900 and 0.7400 since mid-July. As a result, although we may experience some further near-term declines, I would hold a flat stance for now as far as the broader trend is concerned. I prefer to see a clear close below 0.6900 (S2) before assuming that the medium-term outlook has turned negative as well.
• Support: 0.6945 (S1), 0.6900 (S2), 0.6765 (S3)
• Resistance: 0.7025 (R1), 0.7075 (R2), 0.7130 (R3)
Gold pulls back once again
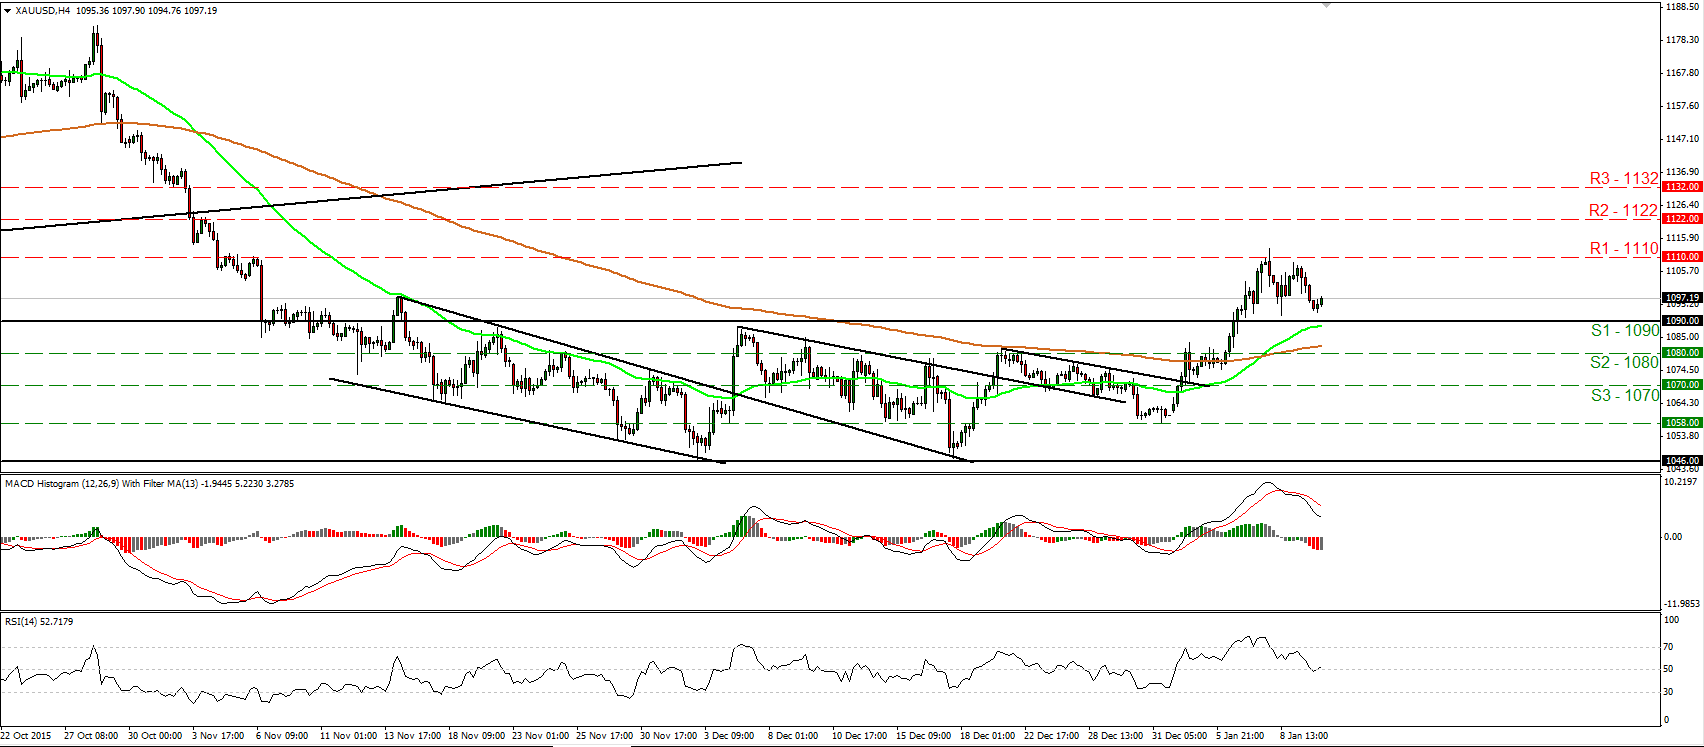
• Gold traded lower yesterday after it hit resistance slightly below the 1110 (R1) resistance barrier. However, the decline was stopped faintly above the 1090 (S1) key level and then the metal rebounded. As long as gold is trading above the 1090 (S1), I would consider the short-term picture to be cautiously positive. A clear break above 1110 (R1) is needed though to confirm a forthcoming higher high on the 4-hour chart, which could set the stage for extensions towards the next resistance zone of 1122 (R2). Our short-term oscillators support somewhat that the current rebound may continue for a while, at least for another test near 1110 (R1). The RSI rebounded from near its 50 line, while the MACD, although below its trigger line, shows signs that it could start bottoming. As for the broader trend, the move above 1090 (S1) signaled the upside exit of the sideways range the precious metal had been trading between that zone and the support area of 1046. Therefore. I believe that medium-term picture has turned somewhat positive as well.
• Support: 1090 (S1), 1080 (S2), 1070 (S3)
• Resistance: 1110 (R1), 1122 (R2), 1132 (R3)
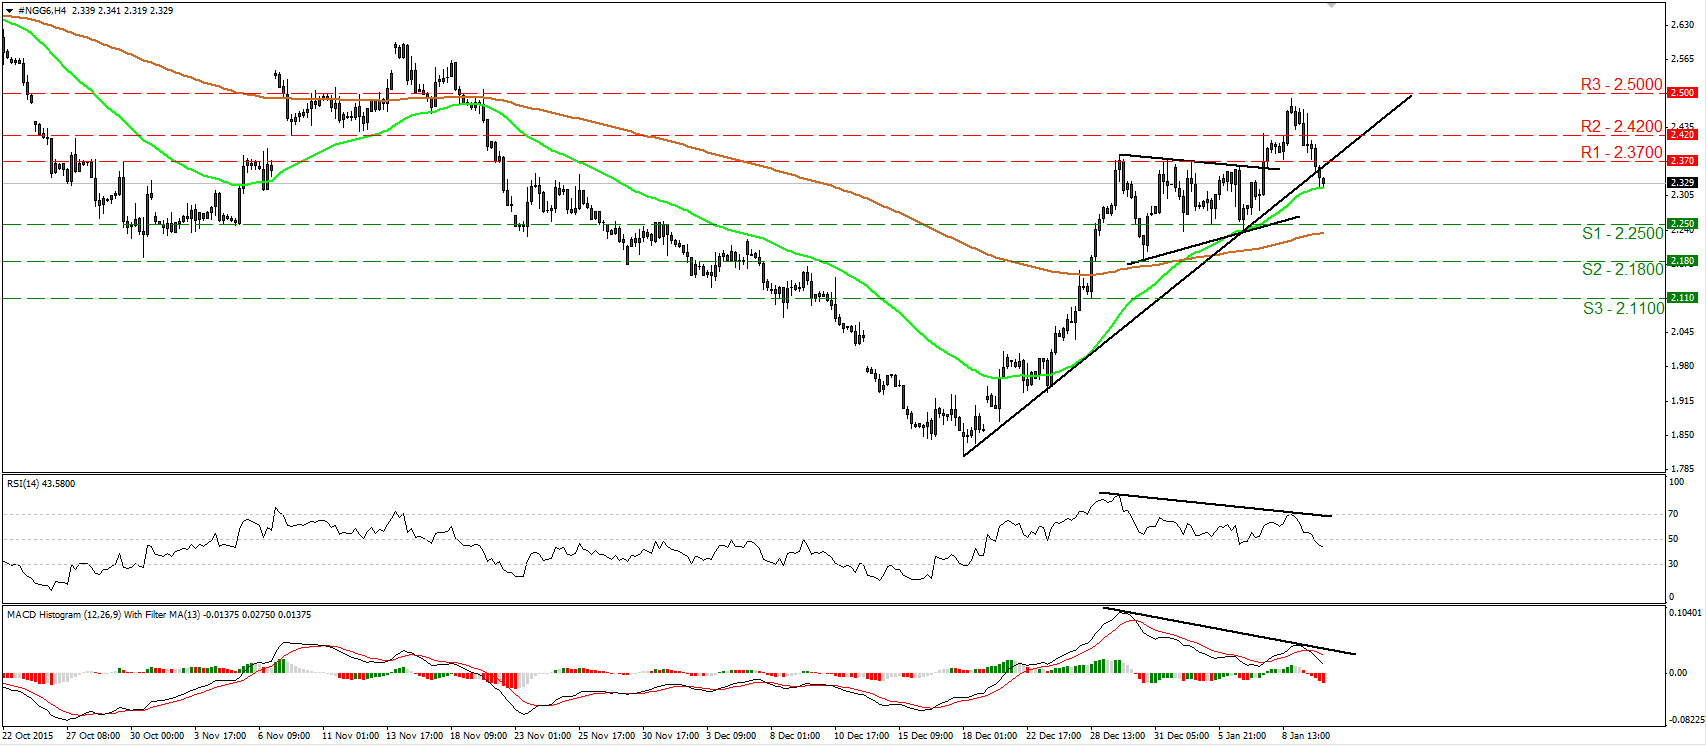
Natural Gas futures tumble after hitting the 2.5000 zone
• Natural Gas tumbled yesterday after it hit resistance marginally below the psychological zone of 2.5000 (R3). Subsequently, the price dipped below the uptrend line taken from the low of the 18th of December, which increases the likelihood for further declines, perhaps for a test near the 2.2500 (S1) support area. Our short-term oscillators detect downside speed and corroborate my view that further declines could be on the cards. The RSI fell below its 50 line and is now pointing down, while the MACD, although positive, has topped and fallen below its trigger line. There is also negative divergence between both these indicators and the price action. On the daily chart, I see that the price started falling after it hit the downside resistance line taken from the peak of the 13th of August. This keeps the longer-term outlook cautiously negative and adds to my view that natural gas is poised to trade lower in the foreseeable future.
• Support: 2.2500 (S1), 2.1800 (S2), 2.1100 (S3)
• Resistance: 2.3700 (R1), 2.4200 (R2), 2.5000 (R3)

