Farmers Rejoice: A Bull Looks to be Coming Back to Grains in 2018.
In the past few weeks, I have highlighted moves up were coming to corn, beans, and wheat. I have mentioned numerous times to my Trends in Futures family that it is my opinion that 2018 will be a good year for grain bulls. Corn is one market I am looking at for a very solid rise in 2018.
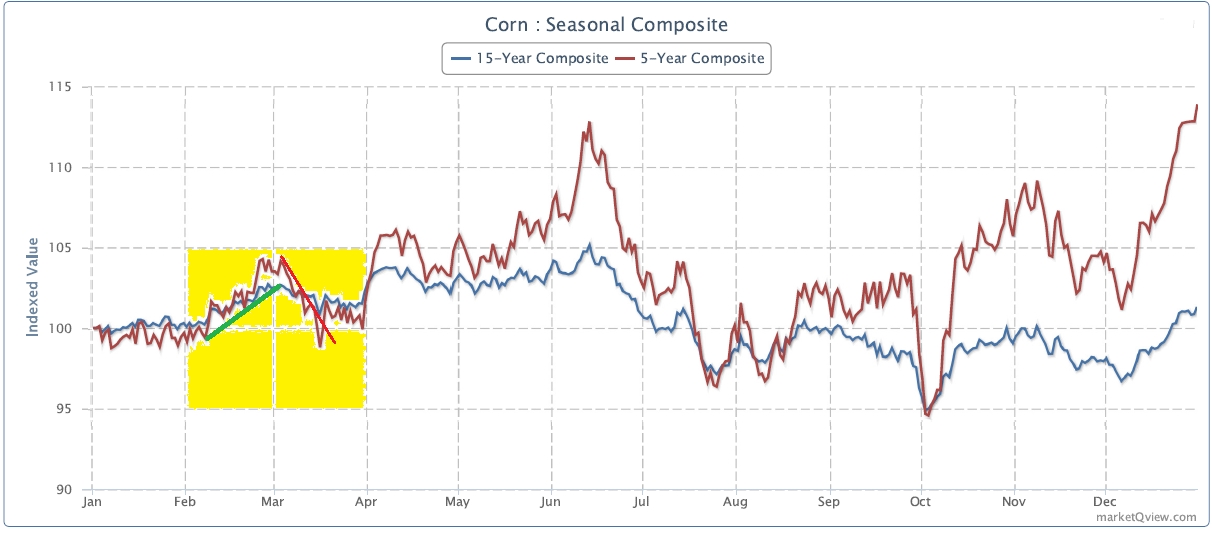
First look at the 5-year and 15-year seasonal chart below. You can see what has happened in the month of February, as well as the month of March as the market awaits Prospective Plantings which will be released this year on Thursday March 29, 2018. Note that seasonals are not something I would use to trade off of by themselves.
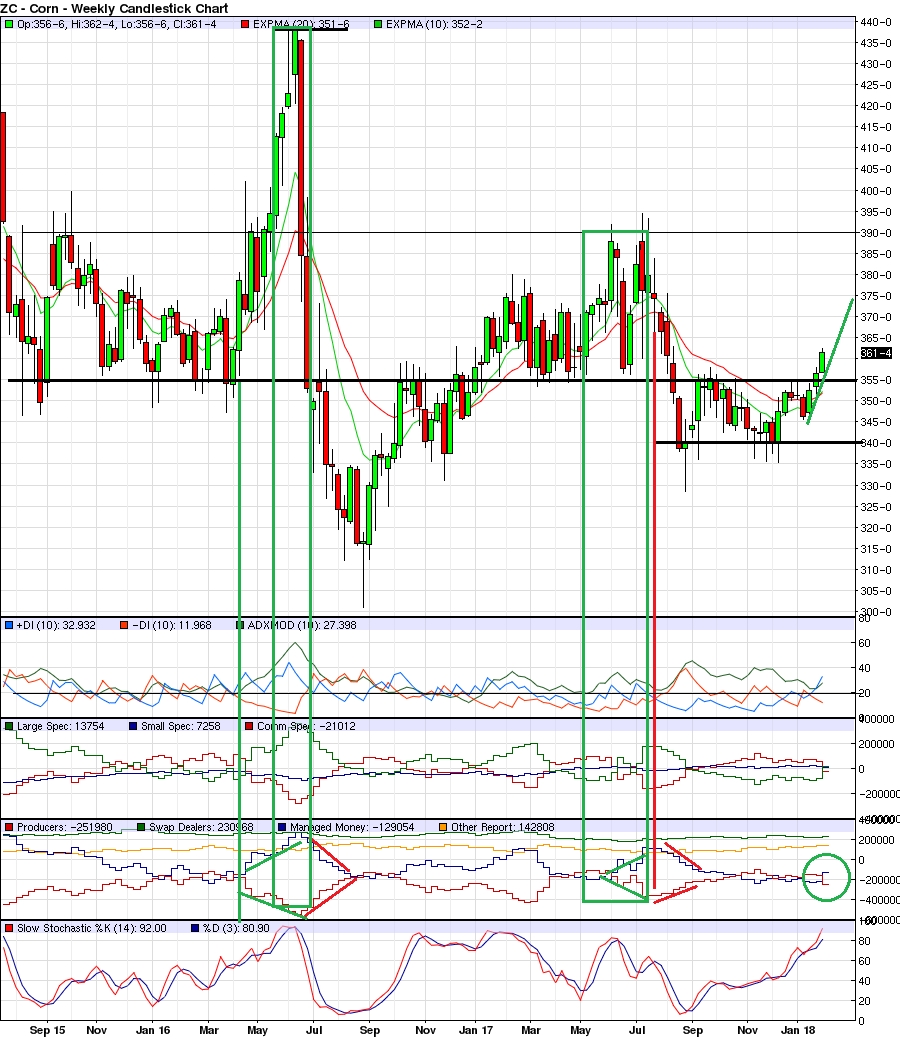
There is something you need to analyze to confirm a seasonal tendency is going to be seen in any market. That can be found on the corn weekly chart below. You can see on the seasonal the high in corn taking place sometime in June and even July. In the long green rectangles you can see where the highs came in. If you look down at the Commitments of Traders Disaggregated Report (the one I highly recommend analyzing now - it is far more transparent to how big money is moving than the old Legacy report) you can see the bullish buy-in by big money that must take place for the seasonal move to take place. The huge ride up seen in 2016 never would have taken place without the strong bullish posture seen by big money. That posture began in April and peaked in June 2016 along with price. Now this past week a solid bull move was seen in the COT and if this movement continues week after week, then week after week corn prices will rise. You can see on the chart what happens at extremes, but look what happens as big money moves to those extremes. Now I do not trade off of the weekly charts, for that look at the daily chart below.
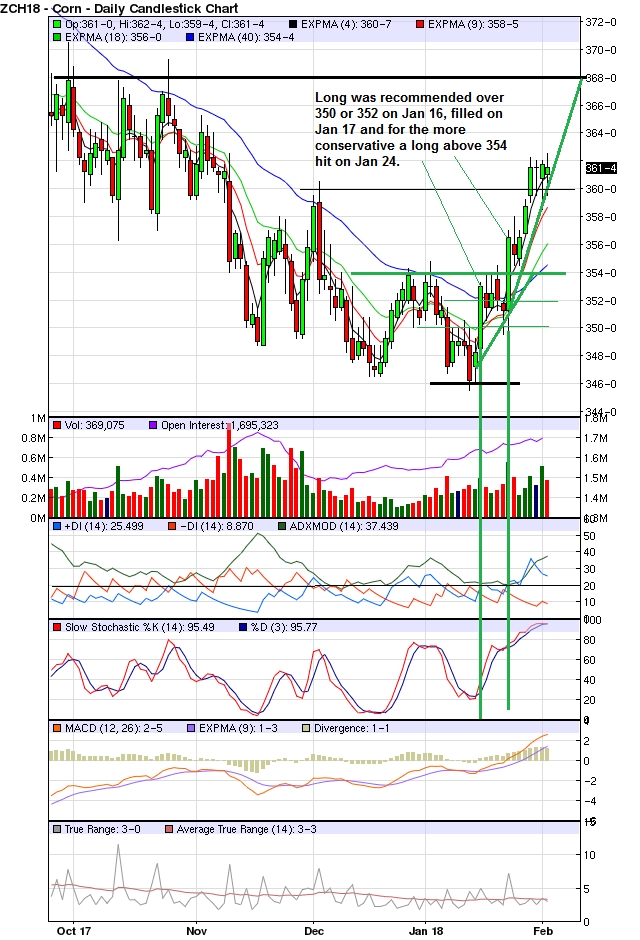
On the March 2018 daily chart you can see where I recommended longs based off of Conditional Market Trading, something I teach at Trends in Futures. It is not enough to know if a market is trending or not. To reliably achieve you trading goals is to quickly and accurately define a market’s condition so you have a clear picture of where the market is headed. The recommendations were made because of corn being in a market condition 1 and 2 between January 17 and January 24. If early price action stays above 360 looking for move up to test 368. A strengthening US dollar could weigh on price next week. Also weather in South America is something to watch.
Have a prosperous week.


