
Capri Holdings Limited (NYSE:CPRI) is slated to release second-quarter fiscal 2020 results on Nov 6, before the market opens. In the trailing four quarters, this designer, marketer, distributor and retailer of branded apparel and accessories has outperformed the Zacks Consensus Estimate by an average of 9.4%. In the last reported quarter, the company registered positive earnings surprise of 5.6%.
The Zacks Consensus Estimate for second-quarter earnings stands at $1.25, suggesting a decline of 1.6% from the year-ago period. We note that the Zacks Consensus Estimate has remained stable in the last 30 days. The consensus estimates for revenues is pegged at $1,453 million, indicating an improvement of about 15.4% from the year-ago quarter.
Key Factors to Note
Capri Holdings’ commitment toward deploying resources to expand product offerings, build “shop-in-shops”, and upgrading information system and distribution infrastructure is likely to get reflected in the top line in the to-be-reported quarter. Notably, the company has been expanding its product mix beyond handbags into men’s, footwear and women’s ready to wear. Moreover, the company’s second-quarter results are anticipated to reflect gains from cost containment efforts, inventory management and focus on the e-commerce platform.
In the last earnings call, management anticipated a double-digit increase in second-quarter revenue to approximately $1.45 billion. This includes revenue contribution of about $220 million from Versace, $125 million from Jimmy Choo and $1.1 billion from Michael Kors.
For a while now, revenues have been soft for Michael Kors, which accounts for a major portion of the company's top line, a trend which is likely to have continued in the second quarter. The company forecasted flat comparable store sales and lower operating margin on a year-over-year basis for the second quarter. Further, management envisioned an increase in comparable store sales for Versace brand but flat comparable store sales for Jimmy Choo brand.
We also note that costs associated with investments in e-commerce expansion, technological advancements and global infrastructure (including new store openings and international expansions) are likely to get reflected in margins, and consequently the bottom line in the second quarter.
Capri Holdings projected a decline of 230 basis points in operating margin to 15% for the second quarter. Again, the company guided earnings per share in the range of $1.21-$1.26 down from $1.27 reported in the year-ago period. The projection took into account dilution from Versace of about 5 cents.
Capri Holdings Limited Price, Consensus and EPS Surprise
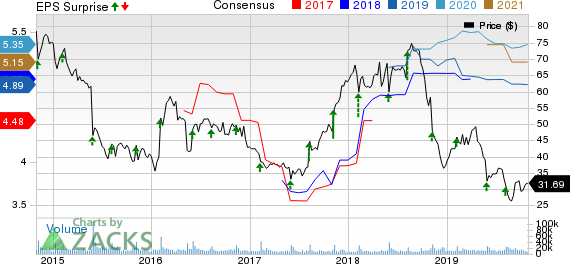
Capri Holdings Limited price-consensus-eps-surprise-chart | Capri Holdings Limited Quote
What the Zacks Model Unveils?
Our proven model does not conclusively predict an earnings beat for Capri Holdings this time around. The combination of a positive Earnings ESP and a Zacks Rank #1 (Strong Buy), 2 (Buy) or 3 (Hold) increases the odds of an earnings beat. But that’s not the case here. You can uncover the best stocks to buy or sell before they’re reported with our Earnings ESP Filter.
Capri Holdings has a Zacks Rank #1 and an Earnings ESP of 0.00%.
3 Stocks With Favorable Combination
Here are three companies you may want to consider as our model shows that these have the right combination of elements to post an earnings beat:
Under Armour (NYSE:UAA) has an Earnings ESP of +9.37% and a Zacks Rank #2. You can see the complete list of today’s Zacks #1 Rank stocks here.
Children's Place (NASDAQ:PLCE) has an Earnings ESP of +17.24% and a Zacks Rank #3.
Ralph Lauren Corporation (NYSE:RL) has an Earnings ESP of +0.67% and a Zacks Rank #3.
Today's Best Stocks from Zacks
Would you like to see the updated picks from our best market-beating strategies? From 2017 through 2018, while the S&P 500 gained +15.8%, five of our screens returned +38.0%, +61.3%, +61.6%, +68.1%, and +98.3%.
This outperformance has not just been a recent phenomenon. From 2000 – 2018, while the S&P averaged +4.8% per year, our top strategies averaged up to +56.2% per year.
See their latest picks free >>
The Children's Place, Inc. (PLCE): Free Stock Analysis Report
Under Armour, Inc. (UAA): Free Stock Analysis Report
Ralph Lauren Corporation (RL): Free Stock Analysis Report
Capri Holdings Limited (CPRI): Free Stock Analysis Report
Original post