
EUR/USD: Draghi maintains dovish tone ahead of ECB June meeting
Macroeconomic overview: Dallas Federal Reserve Bank President Robert Kaplan said he continues to believe U.S. rate hikes should be "gradual and patient," in part because wages and prices are rising more slowly than might have been expected with an economy so close to full employment. His "baseline" view continues to be for three U.S. interest-rate hikes this year, including the increase in March.
Kaplan made clear that part of the reason for raising rates and, later on, trimming the Fed's balance sheet is to better position the Fed to fight a future recession or shock when it comes, but that he was in no mood to rush.
Boston Fed President Eric Rosengren said the current jobless rate at 4.4% has already fallen below his 4.7% estimate of "natural employment." This theoretically is the lowest level possible before wage pressures push inflation too high. "Such an overheated economy would likely be accompanied by higher inflation, which in turn would likely elicit higher interest rates," he said at a commercial real estate conference. Rosengren has pushed for rate hikes over the last year but does not vote again on policy until 2019.
Kansas City Federal Reserve President Esther George said she supported starting to wind down the Fed's massive trove of bonds this year. George does not have a vote on monetary policy this year but participates in discussions. She will next be a voting member of the FOMC in 2019.
The key even today was Mario Draghi’s speech in Dutch Parliament. Investors watched for a possible move towards a more hawkish tone amid strength in the Eurozone economy and receding political risks. But Mario Draghi said: “Incoming data confirm that the cyclical recovery of the euro area economy is becoming increasingly solid and that downside risks have further diminished.” But in his opinion it is too early for the European Central Bank to declare victory in its quest to raise inflation in the Eurozone to its target of almost 2%. He added the benefits of the ECB's ultra-easy policy "clearly outweigh" its potential side effects.
Technical analysis: The EUR/USD corrective move is continued. The pair broke below 14-day exponential moving average and the next support level is 38.2% fibo of April-May rise at 1.0848. A close below this level will reinforce the bearish bias. 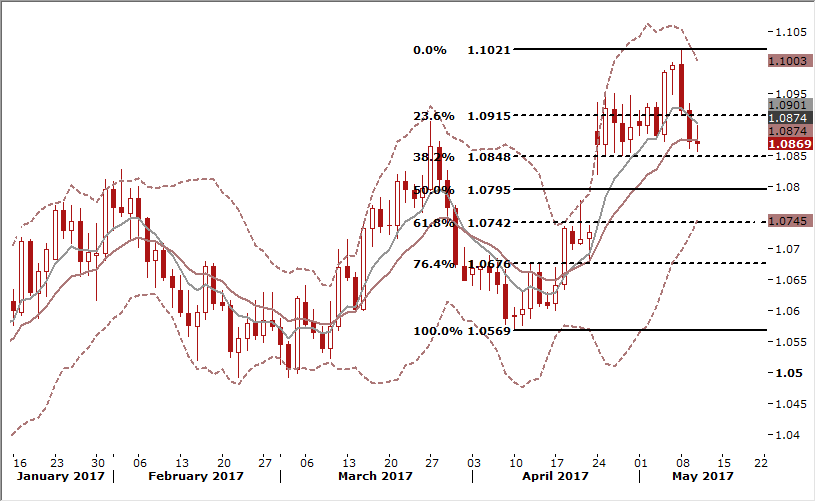
Short-term signal: Stay short for 1.0800
Long-term outlook: Current corrective move does not change bullish long-term outlook
NZD/USD: RBNZ to keep rates on hold
Macroeconomic overview: The Reserve Bank of New Zealand is all-but-certain to keep rates on hold at a record low of 1.75% at its review on Thursday, but investors will be on the lookout for any signs it may move earlier to raise rates as inflation picks up.
In its last statement in March, the central bank reiterated that it would stay on hold for a "considerable" period of time, warning that the recovery in inflation could be temporary and there were growing international risks.
Governor Graeme Wheeler highlighted that growing global protectionism, led by U.S. President Donald Trump, was a major risk for New Zealand's small and open trade-dependent economy.
The central bank had indicated in March that rates could remain unchanged for as long as two years, with external rather than domestic factors determining the outlook. Some economists thought it might do-away with the mention of a timeframe in its next policy statement.
The central bank slashed rates seven times in the last two years, which worked to lift tepid inflation. New Zealand's consumer price index accelerated to a surprisingly brisk 2.2% in the first quarter, the highest in five years.
But some of that gain was due to temporary factors such as higher oil prices and a tax hike on alcohol and tobacco products. Stripping out petrol, alcohol and cigarettes put annual inflation at a more modest 1.5%, though that was still comfortably within the RBNZ's target band of one to three percent.
Technical analysis: The NZD/USD continues its recovery. The pair broke above 14-day exponential moving average and is testing 50% fibo of April drop at 0.6946. A close above this level will open the way to full retracement. Yesterday’s low at 0.6881 is the nearest support. 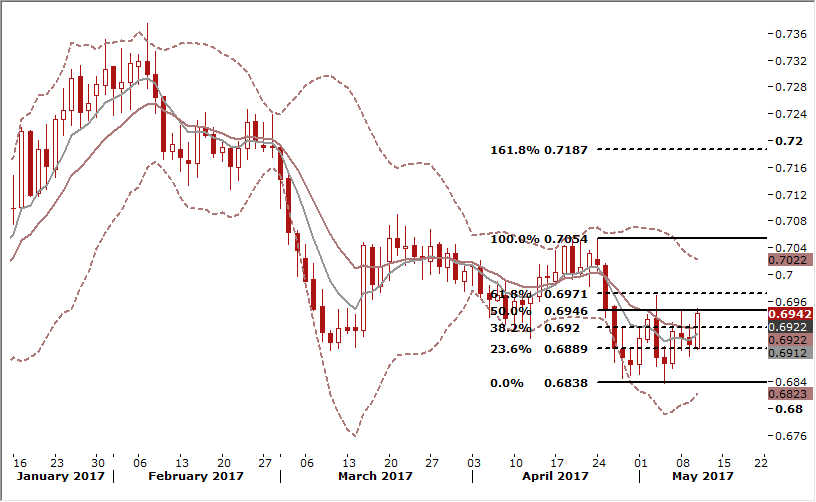
Short-term signal: We do not much more hawkish tone from the RBNZ today, but New Zealand’s fundamentals are getting stronger, which should result in the NZD recovery. We stay long for 0.7150.
Long-term outlook: Bullish
TRADING STRATEGIES SUMMARY:
FOREX - MAJOR PAIRS: 
FOREX - MAJOR CROSSES: 
PRECIOUS METALS: 
How to read these tables?
1. Support/Resistance - three closest important support/resistance levels
2. Position/Trading Idea:
BUY/SELL - It means we are looking to open LONG/SHORT position at the Entry Price. If the order is filled we will set the suggested Target and Stop-loss level.
LONG/SHORT - It means we have already taken this position at the Entry Price and expect the rate to go up/down to the Target level.
3. Stop-Loss/Profit Locked In - Sometimes we move the stop-loss level above (in case of LONG) or below (in case of SHORT) the Entry price. This means that we have locked in profit on this position.
4. Risk Factor - green "*" means high level of confidence (low level of uncertainty), grey "**" means medium level of confidence, red "***" means low level of confidence (high level of uncertainty)
5. Position Size (forex)- position size suggested for a USD 10,000 trading account in mini lots. You can calculate your position size as follows: (your account size in USD / USD 10,000) * (our position size). You should always round the result down. For example, if the result was 2.671, your position size should be 2 mini lots. This would be a great tool for your risk management!
Position size (precious metals) - position size suggested for a USD 10,000 trading account in units. You can calculate your position size as follows: (your account size in USD / USD 10,000) * (our position size).
6. Profit/Loss on recently closed position (forex) - is the amount of pips we have earned/lost on recently closed position. The amount in USD is calculated on the assumption of suggested position size for USD 10,000 trading account.
Profit/Loss on recently closed position (precious metals) - is profit/loss we have earned/lost per unit on recently closed position. The amount in USD is calculated on the assumption of suggested position size for USD 10,000 trading account.
Source: GrowthAces.com - your daily forex trading strategies newsletter