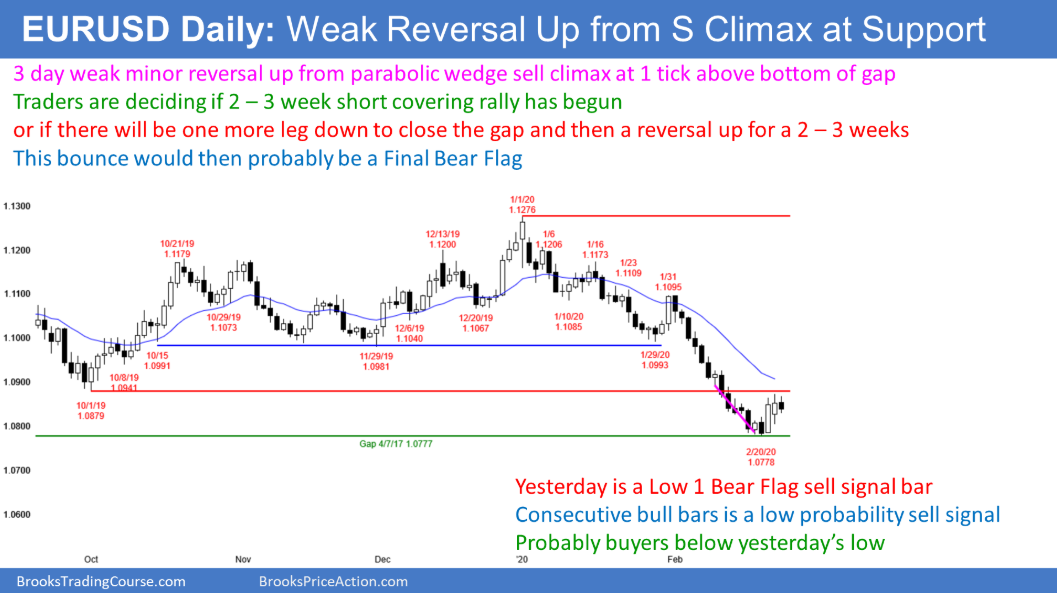
The daily chart of the EUR/USD market reversed up for 2 days from one tick above the bottom of the 2017 gap. There was a small parabolic wedge sell climax at the end of the 3-week selloff. A sell climax at support typically leads to 2 – 3 weeks of profit taking. Traders are deciding if the short covering has begun.
The bulls have consecutive bull bars and a micro double bottom. The context and the bull bars are enough to make at least a small 2nd leg sideways to up likely.
However, the bull bars are not especially big and they have prominent tails on top. This rally will probably not lead to significant profit taking. It is therefore likely that there will be another brief leg down to a new low within a couple weeks. That means the gap will close.
How Much Short Covering?
Whether the rally has begun or there will be one more brief leg down does not matter. Traders expect a 2 – 3 week short covering rally that is relatively strong after such an extreme sell climax.For example, they would like to see a rally that has at least 2 legs up. Furthermore, they think the rally will go back above the October low and possibly to the January low. That means the rally will probably go up 150 – 200 pips.What no one yet knows is if the rally has begun. At the moment, the current rally will probably not meet those objectives. It there therefore more likely to be a small bear flag. If so, it will probably be the Final Bear Flag. That means one more leg down before there would then be the expected short covering rally to above the October low.
Overnight EUR/USD Forex Trading
The 5 minute chart of the EUR/USD Forex market rallied a little overnight. It then sold off to a new low and bounced. This is trading range price action.
Yesterday is a sell signal bar for today. But it is the 2nd consecutive bull bar on the daily chart after a sell climax. If today trades below yesterday’s low, there will probably be more buyers than sellers there.
The bears want a better sell signal bar on the daily chart. They therefore will try to get today to close near its low. That would make today a more reliable sell signal bar. The 3 day rally would be a Low 1 bear flag. But even then, at least a 2nd leg sideways to up is likely after the micro double bottom and consecutive bull bars.
The fight today is over the close. The bears will sell rallies and try to get the day to close near its low. Since the bulls do not want a good sell signal bar on the daily chart, they will buy around the low of the day. They will try to get the day to close above its middle or at least 10 – 20 pips above the low.
Traders are exhausted. They will probably need at least a few more days to decide whether this rally is the start of a 200 pip short covering rally or just a brief bear flag. This hesitation reduces the chance of a big trend day up or down today.
