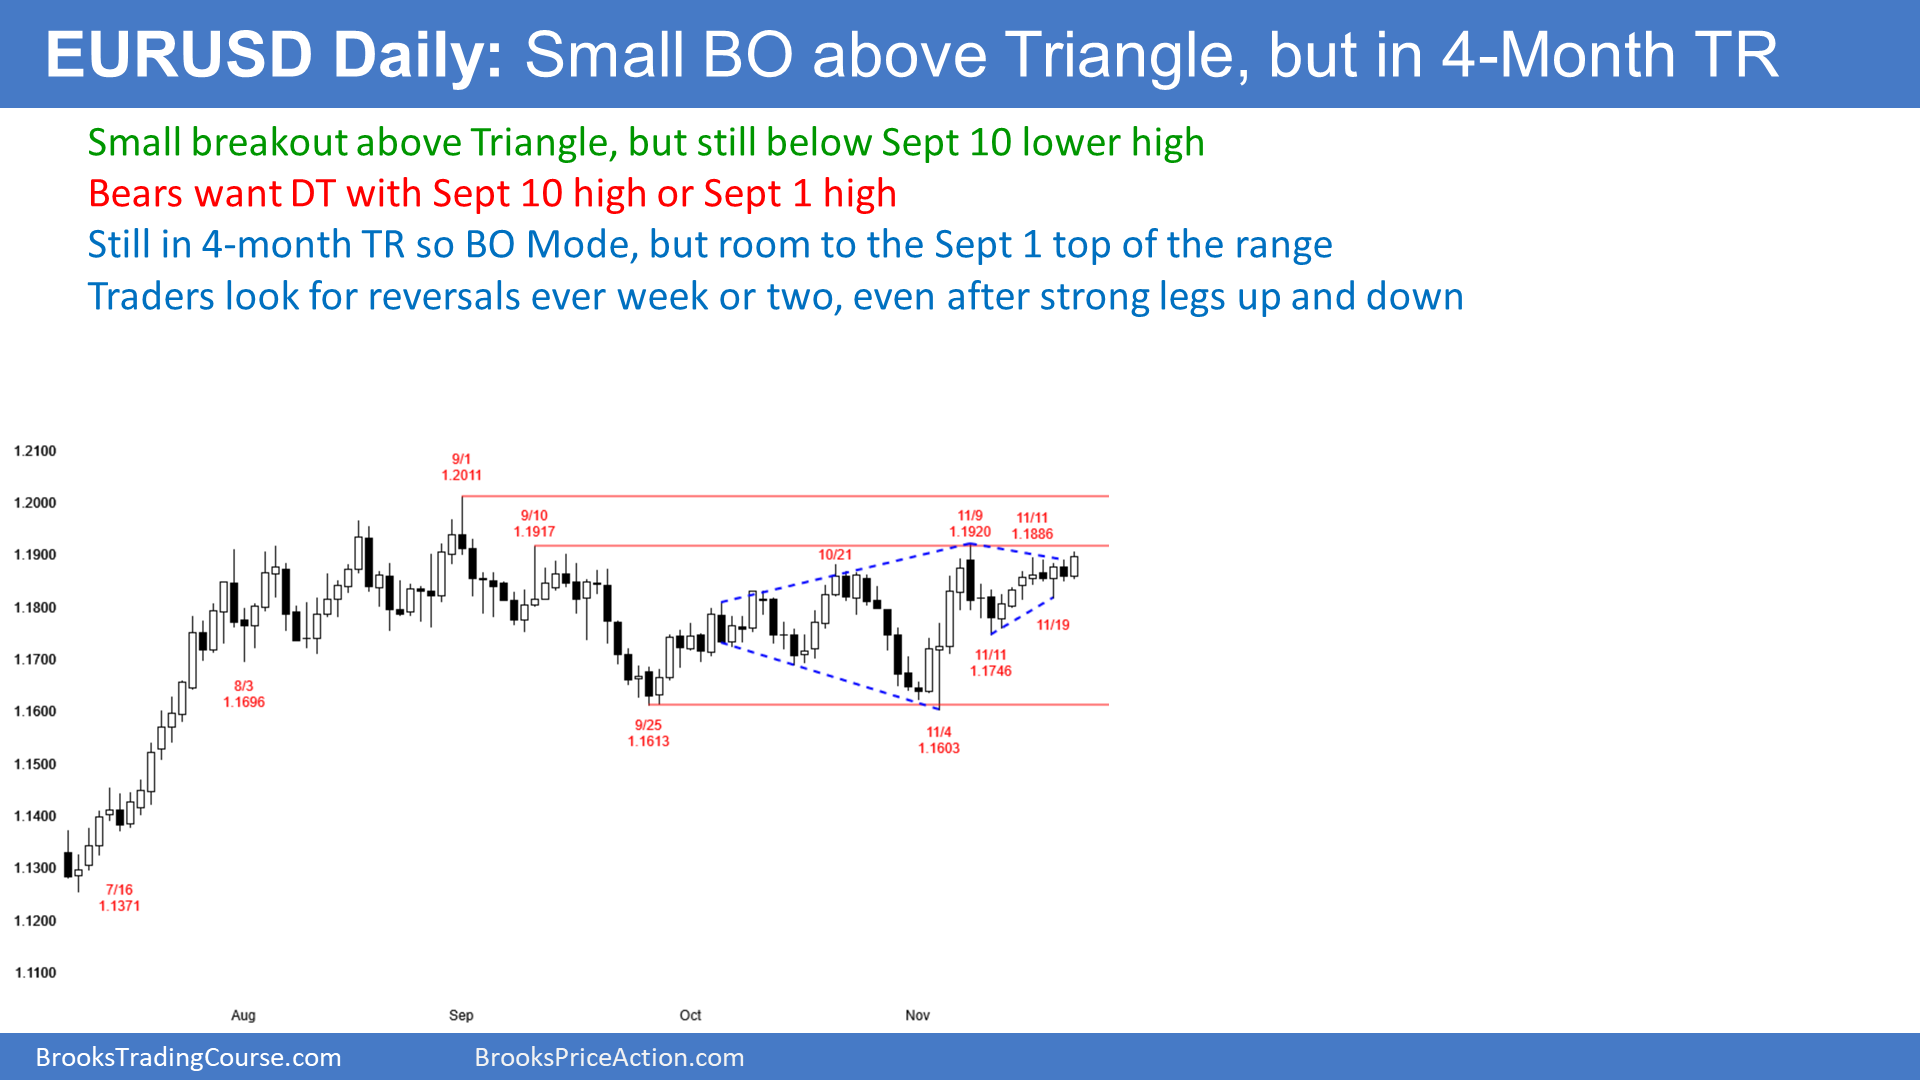
The EUR/USD forex market on the daily chart is breaking above its 2-week triangle, but it is still below the Sept. 10 lower high and the top of the 4-month trading range. Until there are consecutive closes above or below the range, traders will continue to look for reversals.

Today’s high is also above last week’s high. Today is therefore triggering a High 1 bull flag buy signal in the weekly chart (I showed the chart over the weekend). But today’s breakout so far is small. Also, the EUR/USD twice tried to break above the September 10 high last week, but both days reversed down.
What does a successful breakout look like?
Will the bulls succeed this time? There are 2 common ways that a bull breakout succeeds. First, there can be a big bull bar closing far above the resistance. There is still time for this today, but there is no sign that it is about to happen.
Next, there can be a series of small bull days, with 2 or more of the closes above the breakout point. Therefore, even though today’s range is not big, the breakout could still be this gradual type over the next few days.
The key for the bulls is to have today close above the open, and preferably near the high. Then, the bulls will try to get either a series of bull days that gradually close above the September 10/November 9 double top, or a big bull bar closing far above that resistance.
About half of triangle breakouts fail. Therefore, the bears will try to get a reversal down this week. They want either a day that rallies and then reverses down and closes on its low, or a very big bear bar closing far below the bull trend line at the bottom of the triangle.
Overnight EUR/USD Forex trading
The 5-minute chart of the EUR/USD forex market rallied briefly overnight to slightly above Friday’s high and last week’s high, but it then has been sideways for 3 hours. The bulls are trying to continue the breakout to above the Nov. 9 high, and then have the day close above that high. At a minimum, they want today to have a bull body and close above Friday’s high. That would increase the chance of a breakout above the November 9 high tomorrow.
Will the bulls get their breakout or will the bears get a reversal today? Right now, it looks like the bulls are simply trying to keep the day near the high. They have been buying pullbacks, but they have not been buying at the high. With the chart sideways for 3 hours, the bulls have switched to scalping, while hoping for the breakout.
The pullbacks have only been 15 pips overnight. That is not enough to make day traders short. If the 5-minute chart continues sideways and forms a double top, the bears will begin to short, hoping for a reversal day. But right now, day traders are only buying for scalps and hoping for a big bull breakout or a big reversal down.
