Don’t look now, but the US dollar seems to be officially getting its mojo back!
In terms of fundamental factors supporting the greenback, the new-look Federal Reserve has struck a more upbeat note about the economy lately, mirroring the improvement in the underlying data. Crucially, US treasury yields are also on the rise again, with the benchmark 10-year bond yield now testing the 3.0% barrier, near the highest level since 2011.
As much as the buck’s move is being driven by positive domestic developments, weakness in its biggest rival is also playing a role. The Eurozone in particular has seen a run of weak economic data, including yesterday’s mediocre Eurozone PMI figures and today’s disappointing German IFO report. As a result, traders have started to price in a small probability that the ECB could actually cut interest rates by the end of the year.
While we still believe the Eurozone is on the way to normalization, that path may not be as smooth or as rapid as generally expected earlier this year (Thursday’s ECB meeting will provide further insight into the central bank's plans). Indeed, the most recent Commitment of Traders report from the CFTC showed that euro futures traders are holding a record net long exposure to the currency, so there’s still potential for EUR/USD to fall further from here.
Possible Top
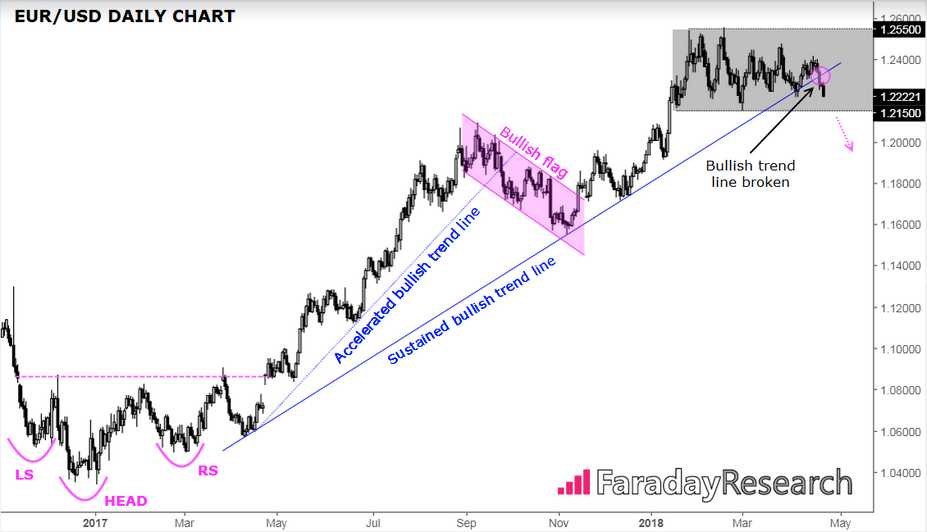
Turning out attention to the chart, there are some tentative signs that the world’s most heavily traded currency pair could be carving out a potential top. EUR/USD has been on a tear since forming an inverted head-and-shoulders pattern just above parity (1.00) in early 2017. Since then, the pair has tacked on more than 2,000 pips to hit the highest level since 2014. So far this year, rates have been contained to a roughly 400-pip range between 1.2150 and 1.2550.

Source: TradingView, Faraday Research
Last week’s selling pressure pushed the pair down to break through 1-year bullish trend line support, though it’s worth noting that the end of the uptrend doesn’t mean that a downtrend is now inevitable. Technically speaking, the dominant feature of the chart is the aforementioned sideways range between 1.2150 and 1.2550.
Considering the lopsided long positioning in EUR/USD, a break below support near 1.2150 could lead to a panicked, run-for-the-exits scenario for euro bulls, potentially taking the pair back below 1.20 in short order. That said, as long as rates can hold steady near current levels, bulls can comfort themselves in the fact that the long-term series of higher highs and higher lows remains intact.
Cheers,
