EUR/USD: Sell on Rallies Still Favoured Unless a Turkish U-Turn
Volumes & Correlations (H4)
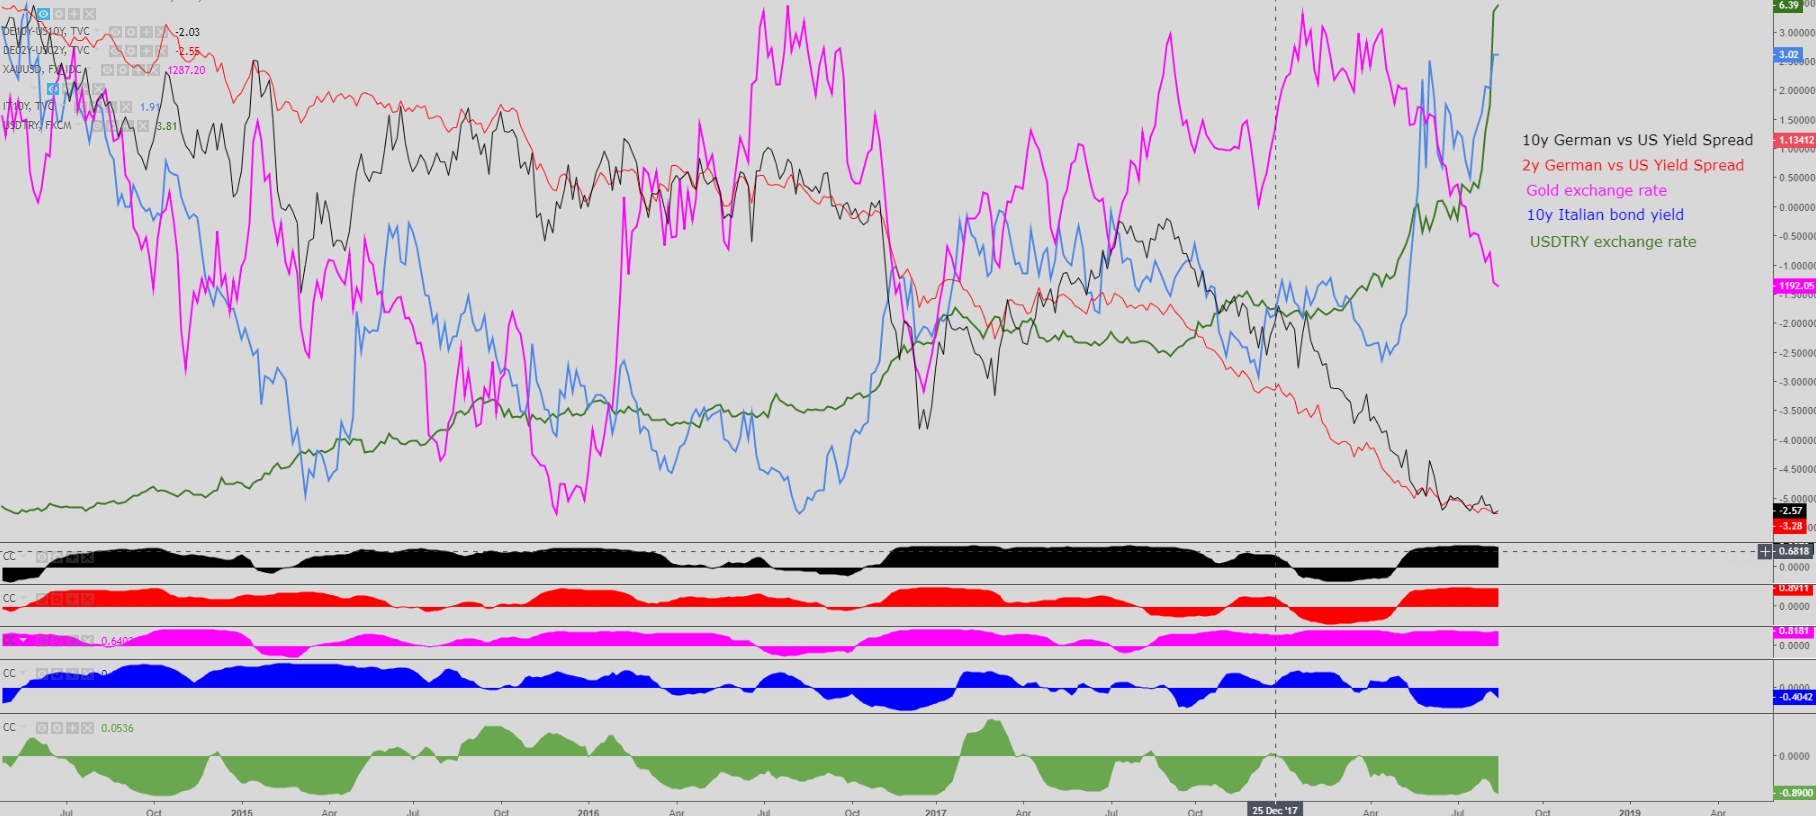
- First off, as a reminder, from a 3d return perspective on a 3m correlation, the Euro/US Dollar exchange rate continues to be strongly correlated to the differential in yield spreads between Germany and the US, less so against the Italian bond yields, which nonetheless remains a source of concern for investors, but most importantly, the correlation with the falling Turkish Lira is the highest we’ve seen on record, which substantiates the notion of monitoring these assets for potential diverging clues. The chart below illustrates the described correlations:
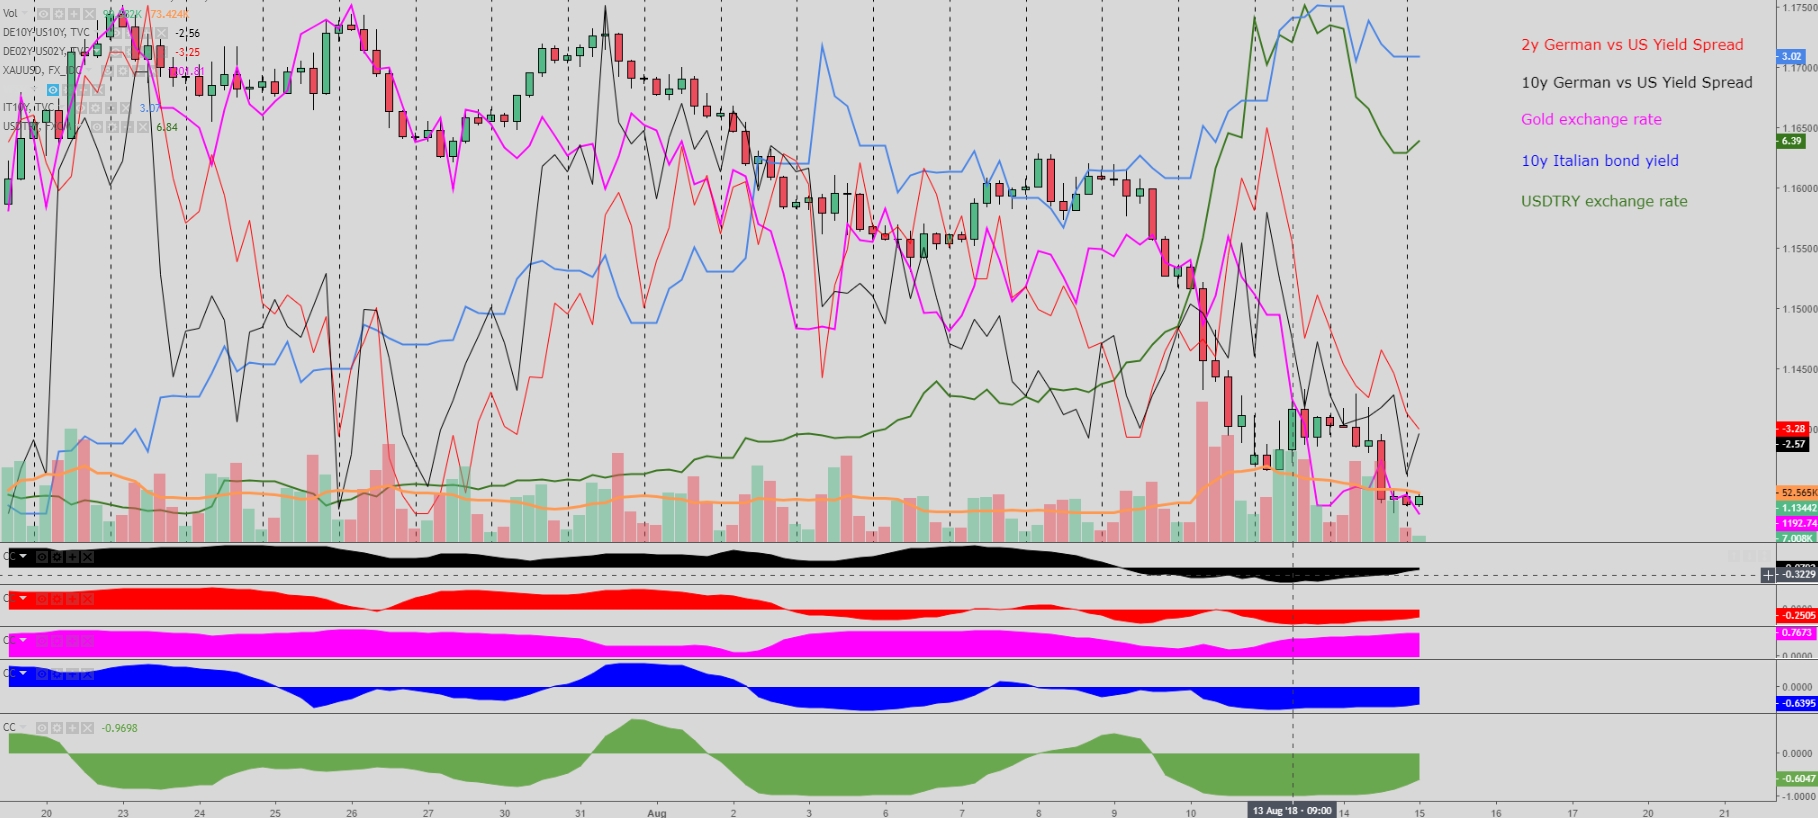
- Drilling down into the H4 chart, there has been a substantial decline in GE-US yields spreads in the last 24h, Italian yields remain at elevated levels, and gold is sliding further, all supporting a lower Euro. On the positive side, the retracement in the Turkish Lira, which has been the key driver for a cheaper Euro, may see today’s downside risk not as prevalent or at least more contained. While the decline in the Euro carries overall decreasing volumes, the pushes lower are still fueled with greater sell-side volumes than the tepid buying interest activity. Overall, the more macro picture in the Euro/US Dollar remains quite negative, with the chart not providing enough reversal hints.
Intraday Chart (30m)
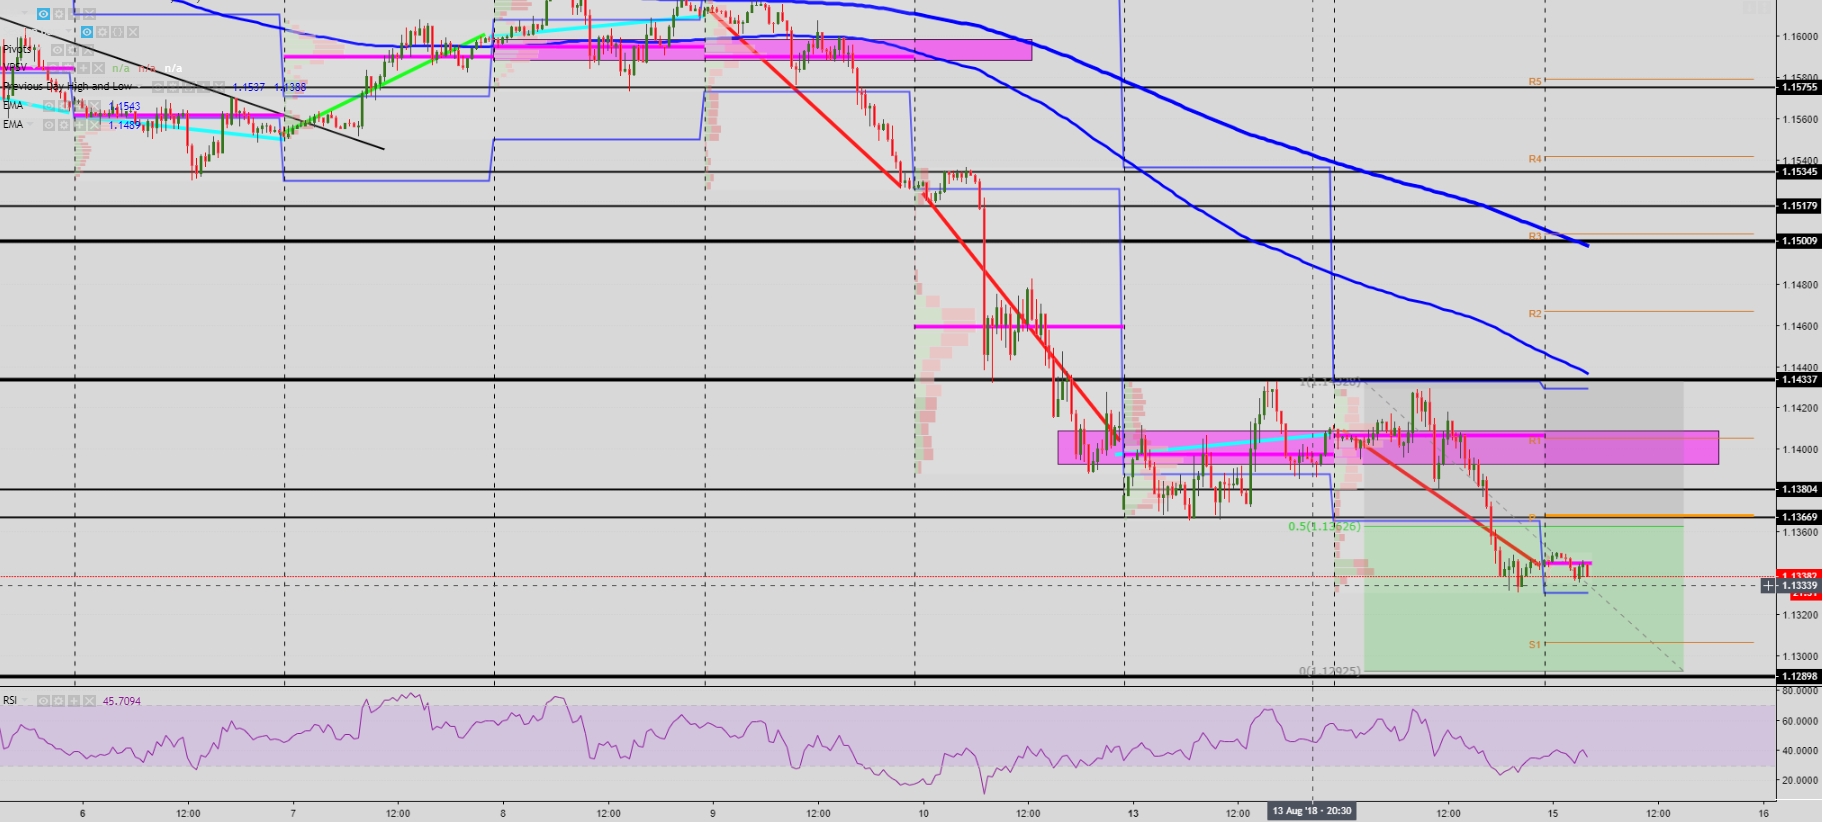
- Technically, the exchange rate is overwhelmingly bearish, with the consolidation near trend lows the first indication that we are faced with a market where sellers are yet to take profits off the table, as lower value is agreed and value built. The last fall has had a clean breakout of 1.1365-70 support, which suggests that any rebound could represent a decent selling opportunity. I am looking to be a seller if conditions align. The main areas where I will be looking to engage, barring any new development in the Turkish Lira drama, include 1.1365 up to 1.1380 (the pivot level is found around this area). If the snap back up extends, expect the PoC (Point of Control) circa 1.14 to represent a major wall for the recovery to run out of juice. On the unlikely scenario, as the risk environment stands, that the Euro breaks higher, 1.1430-35 is a major resistance, which would be further reinforced by the intersection of the 100-hourly MA. Note, the anticipated sell-side follow through is likely to target the area around 1.13 (100% fib projection), where the bearish leg should find a tentative bottom.
3rd party Ad. Not an offer or recommendation by Investing.com. See disclosure here or
remove ads
.
GBP/USD: Sellers in Full Control w/UK CPI a Risk Event
Volumes & Correlations (H4)
- Right off the bat, one can clearly see how strongly inversely correlated the Sterling has been to the performance of the DXY, while a significant divergence seems to exist against the 10yr UK-US yield spread, although for the time being, that should not represent the main driver for the Pound as long as the situation in Turkey remains fluid and the increasing odds of a Brexit no-deal prospects are somehow reverted. Judging by the bearish breakout seen, with a close near the daily lows by NY 5pm, one should expect the bearish trend to resume.
Intraday Chart (30m)
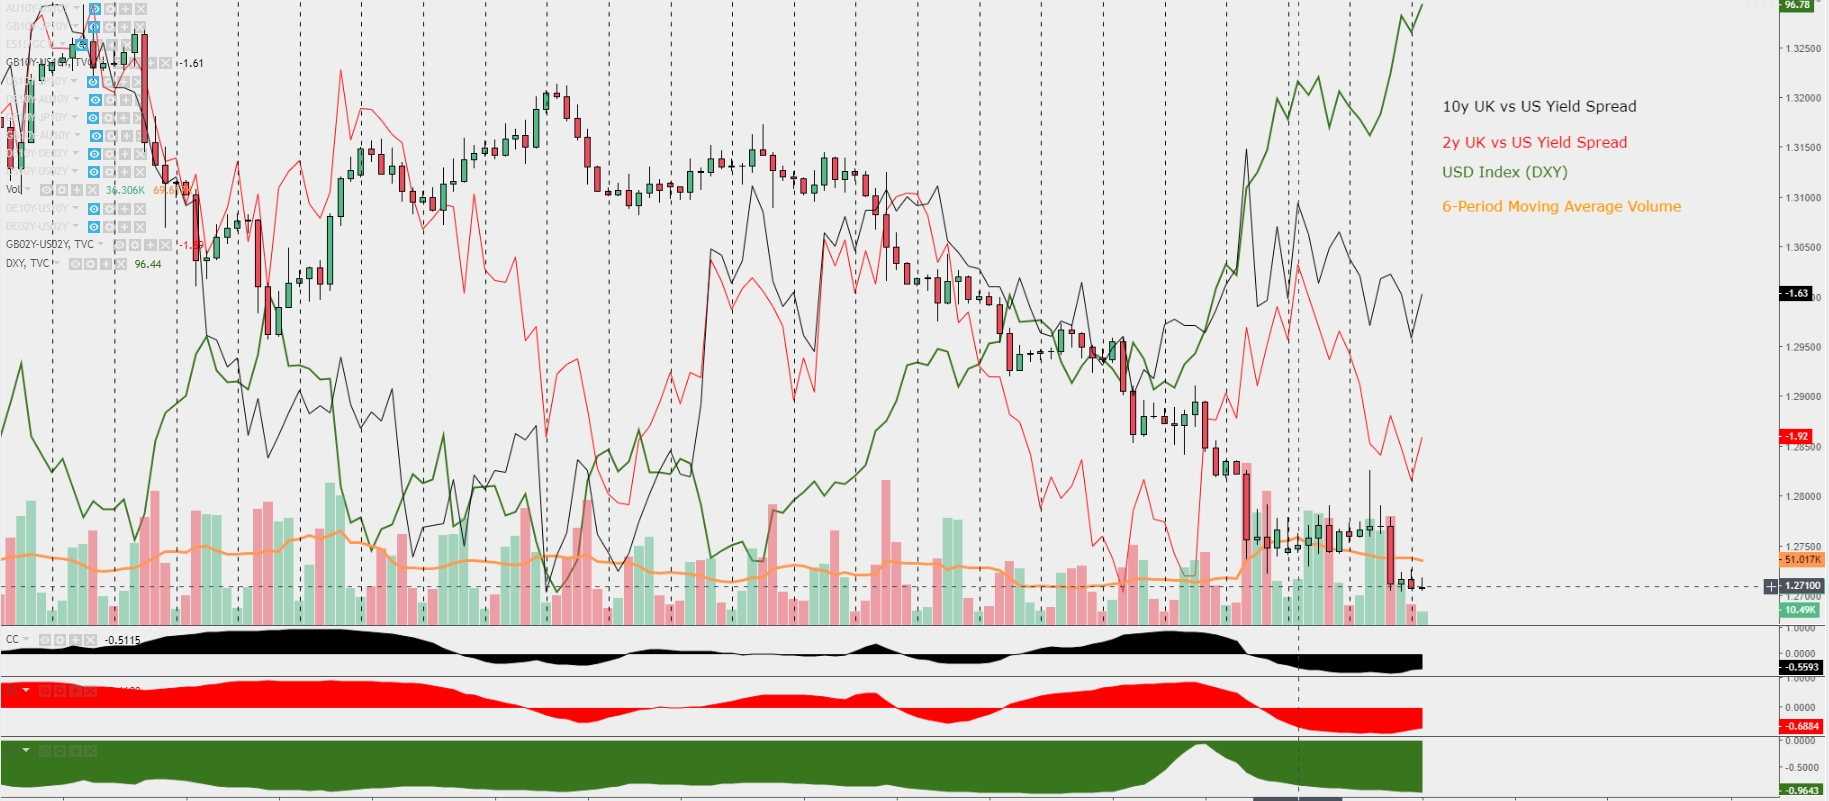
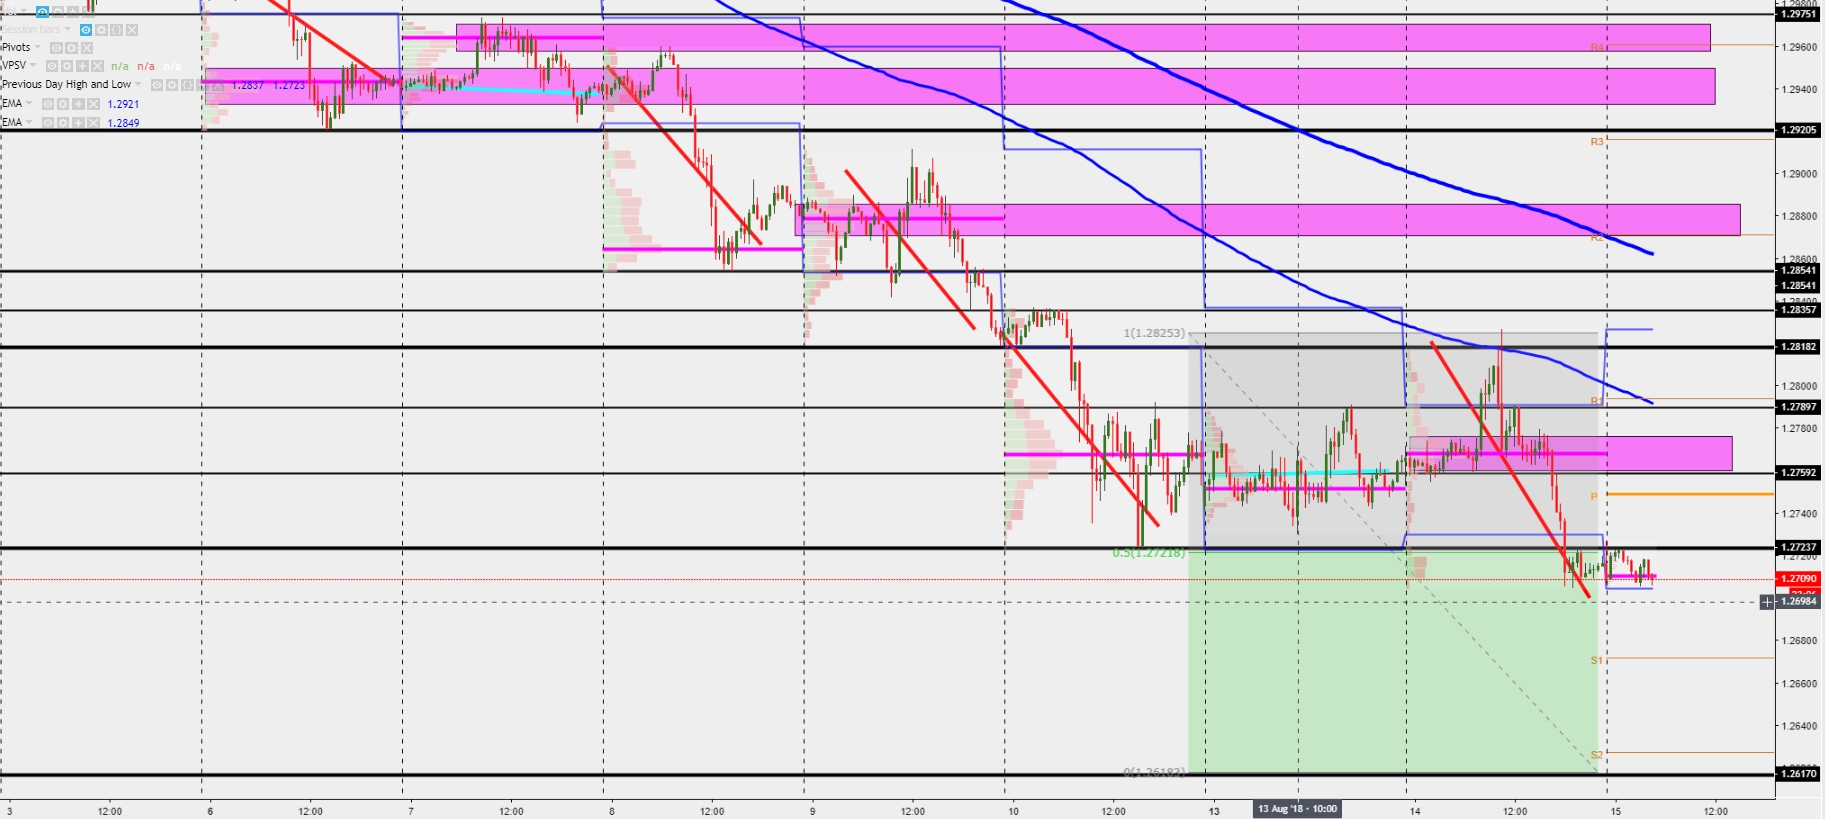
- The decline in the Sterling has led to market participants treating old support as a new resistance at the 1.2725 vicinity, a first hint that the bearish phase is finding increasing sell-side pressure for a continuation lower. From a technical standpoint, sellers are in a position to exploit over 90p of downside void potential, as no significant area of macro support is found until the exchange rate reaches 1.2620-1.26, although with the usual caveats of expecting solid pockets of liquidity at the mid and round numbers as usual. The ultimate target aforementioned aligns with a 100% fib extension from the recent 1c area of consolidation between 1.2820-1.2720. Early in Europe, should a setback in the Pound occur that leads to the rate exchange hands higher – risk exist on UK CPI – the area of resistance between 1.2760-1.2775, where the prior day’s PoC crosses, should be perceived as an area of value for sellers to re-engage in sell-side action. Above, 1.2790 up to 1.2820 sees new layers of resistance as depicted by the horizontal lines in the chart, including the round number 1.28. My preference to be a seller on rallies is firm for the time being.
3rd party Ad. Not an offer or recommendation by Investing.com. See disclosure here or
remove ads
.
USD/JPY: The V-Shape Reversal Hints More Upside Ahead
Volumes & Correlations (H4)
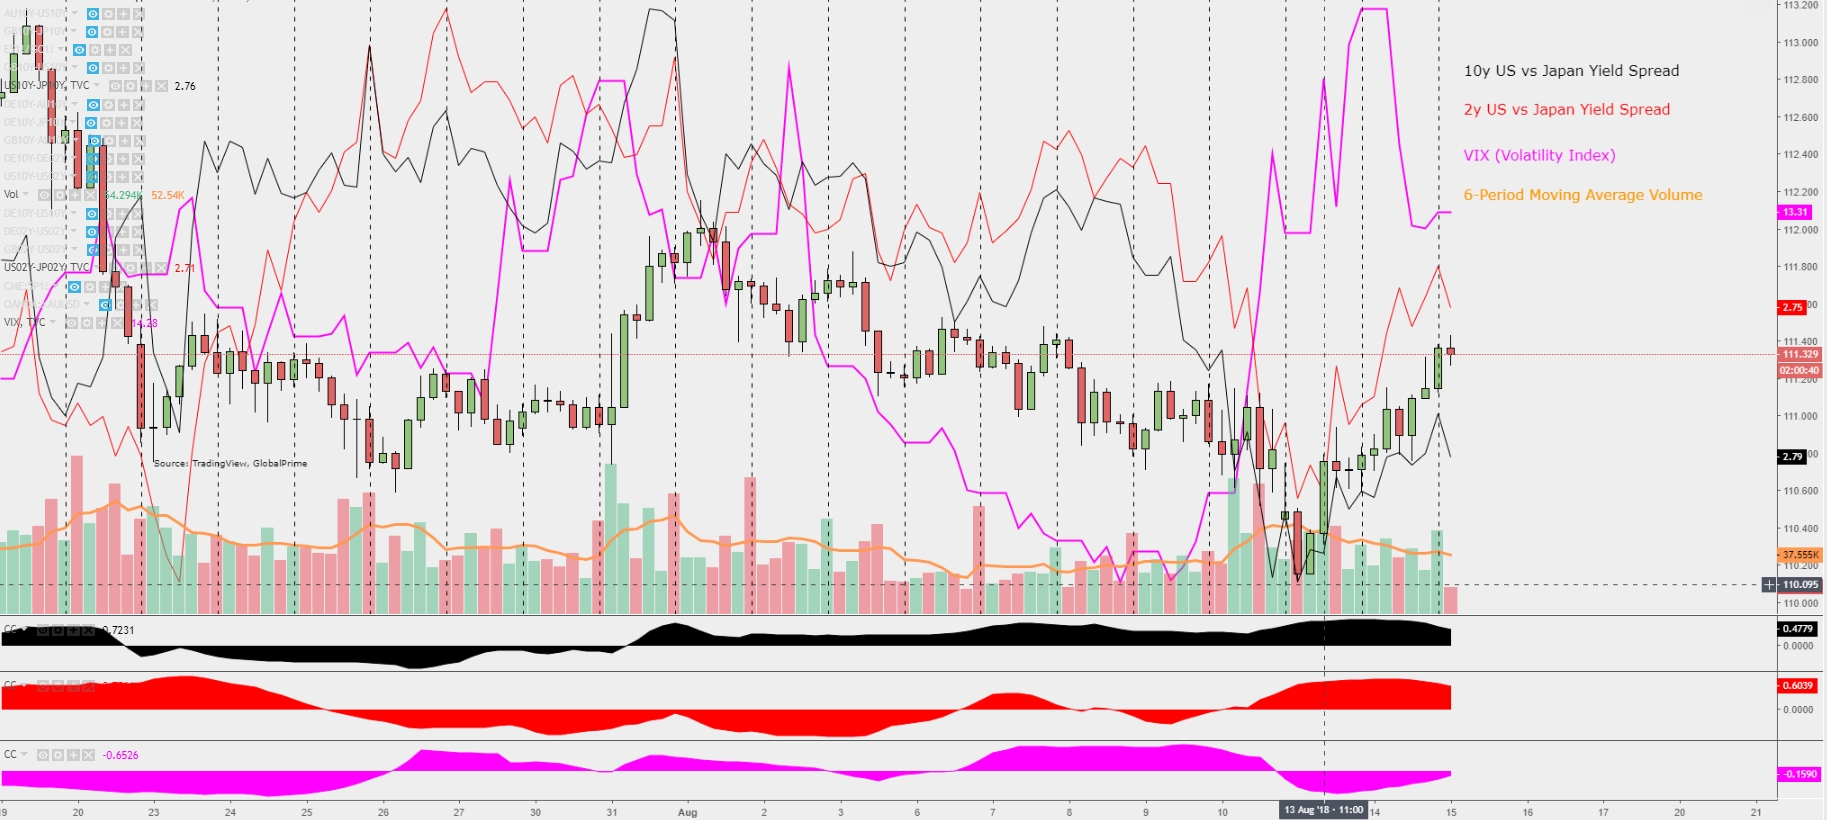
- The steady volume activity throughout Tuesday, along with a close at the absolute highs of the day by NY 5pm communicates that the market should remain predominantly bullish. The recovery in the US vs JP 10yr yield spread, together with a significant decrease in the VIX volatility index further anchors the bullish view. It’s worth noting how Monday’s spike in the VIX failed to yield any gains for the JPY against the USD, a hint that the market was clearly failing to find enough sell-side interest.
Intraday Chart (30m)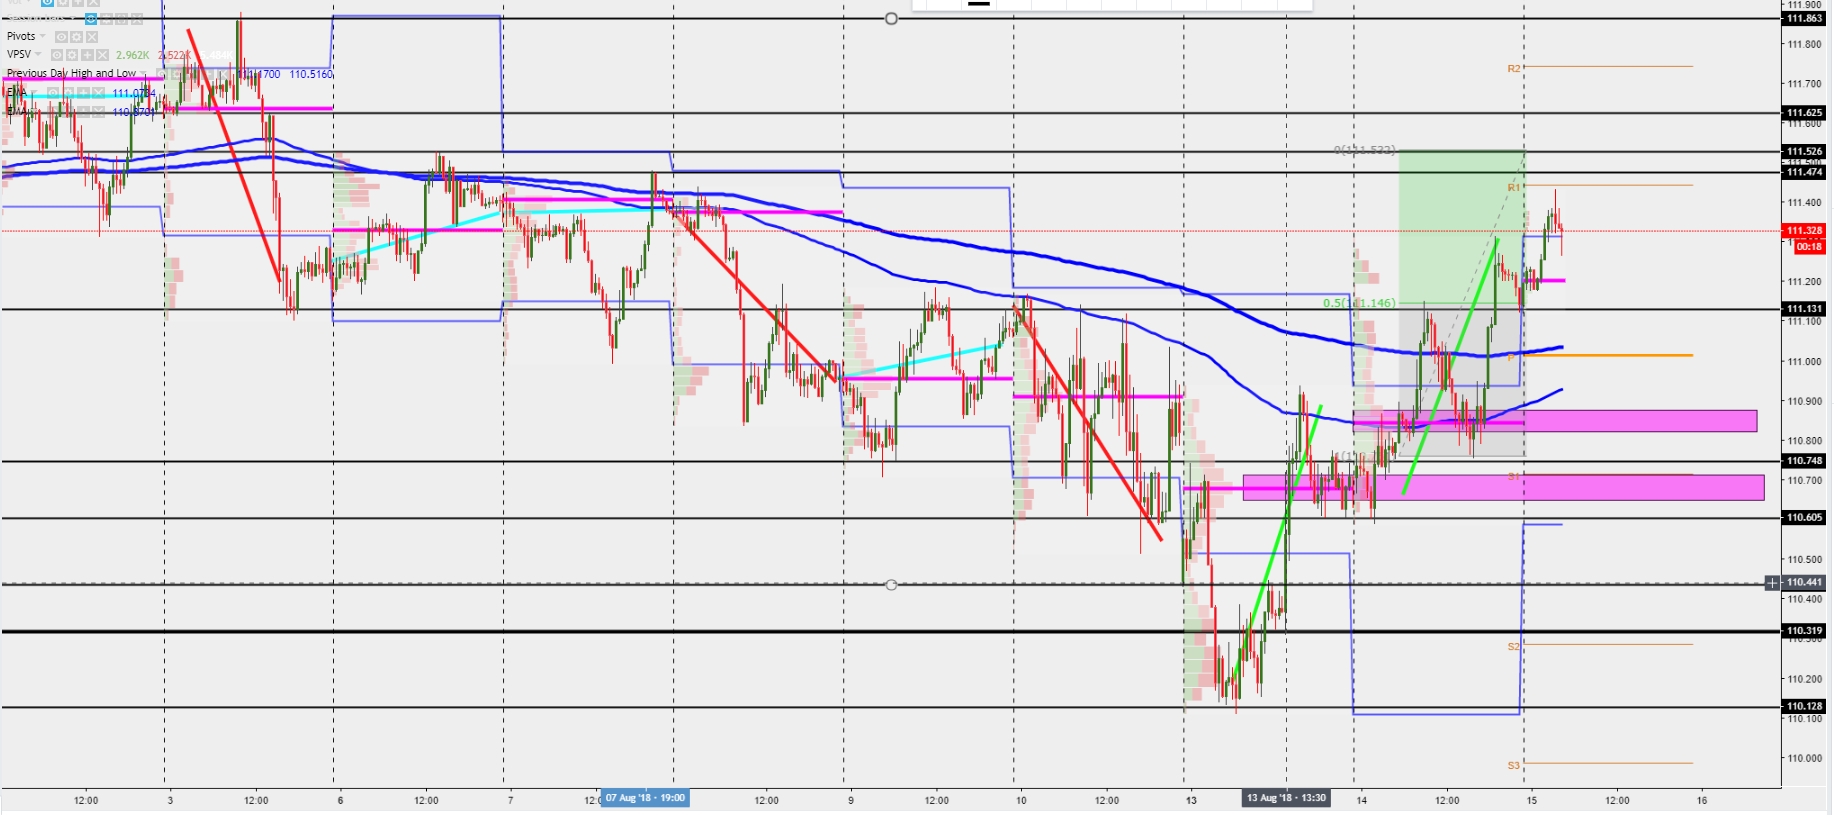
- The 2nd leg of the developing bullish phase came amid yet another impulsive push. Value continues to be found at higher prices as per the accumulation of volume above the 111.00 mark. One would expect that after 2 cycles up, bulls would be grouping and ready to take it even higher in the next 24h. The areas of most interest to engage in the intraday bullish tendencies include the PoC of Wed in Asia circa 111.20, followed by the latest swing low at 111.13 and ahead of the round number at 111.00, which aligns with the daily pivot and the crossing of the 200-hourly MA. Even if further setbacks are witnessed, Tuesday’s PoC around 110.80-90 should act as a wall for prices to rebound. At this stage, it’s unlikely to see the bullish structure disrupted before price travels further north and completes at least a 3rd leg up, which should take the price to the first target of 111.50-60, where offers are expected to contain price on its first pass; further rises see 111.85 and 112.00 as the next targets. As the structure stands, I am looking to be a buyer on dips as the strategy to allocate the highest threshold of risk.
3rd party Ad. Not an offer or recommendation by Investing.com. See disclosure here or
remove ads
.
AUD/USD: No Reason Not to Remain an Intraday Seller
Volumes & Correlations (H4)
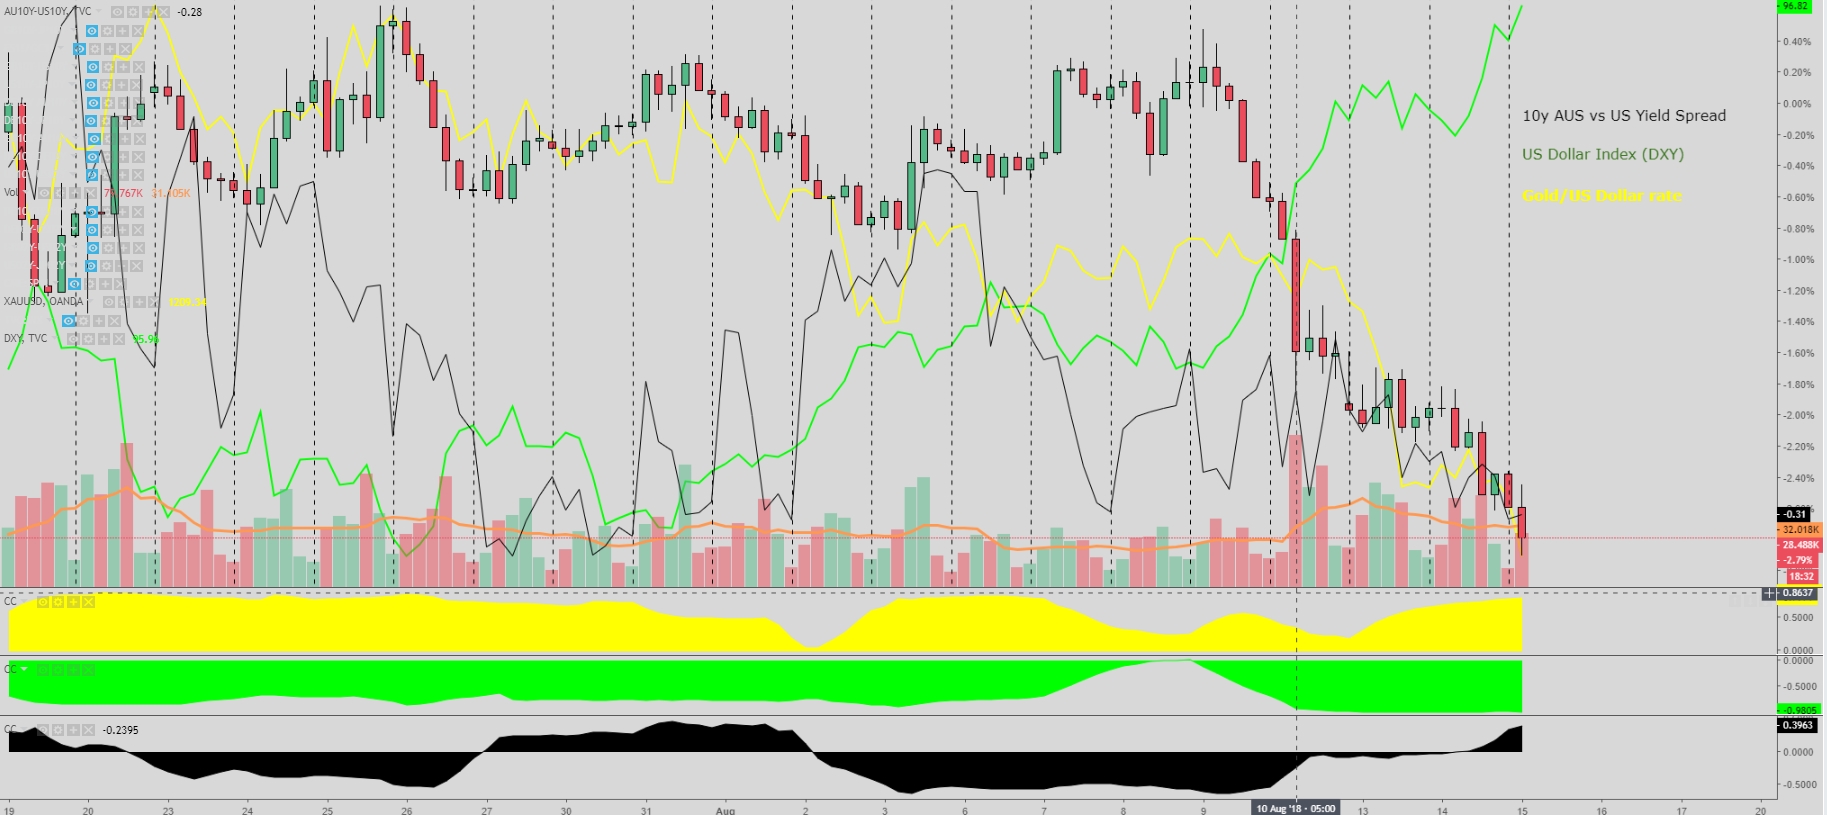
- The macro chart appears to point out towards an extension of the bearish mode, as both volume activity and Intermarket analysis move in tandem for the interest of sellers. While the overstretched nature of the bearish leg is very obvious by now, there are so far no indications that the tide is turning. The fact that Turkey is imposing fresh tariffs on US imports, and the Chinese Yuan is weakening further against the USD (last above 6.90) are two additional drivers weighing on emerging markets and as a consequence on the Australian Dollar.
Intraday Chart (30m)
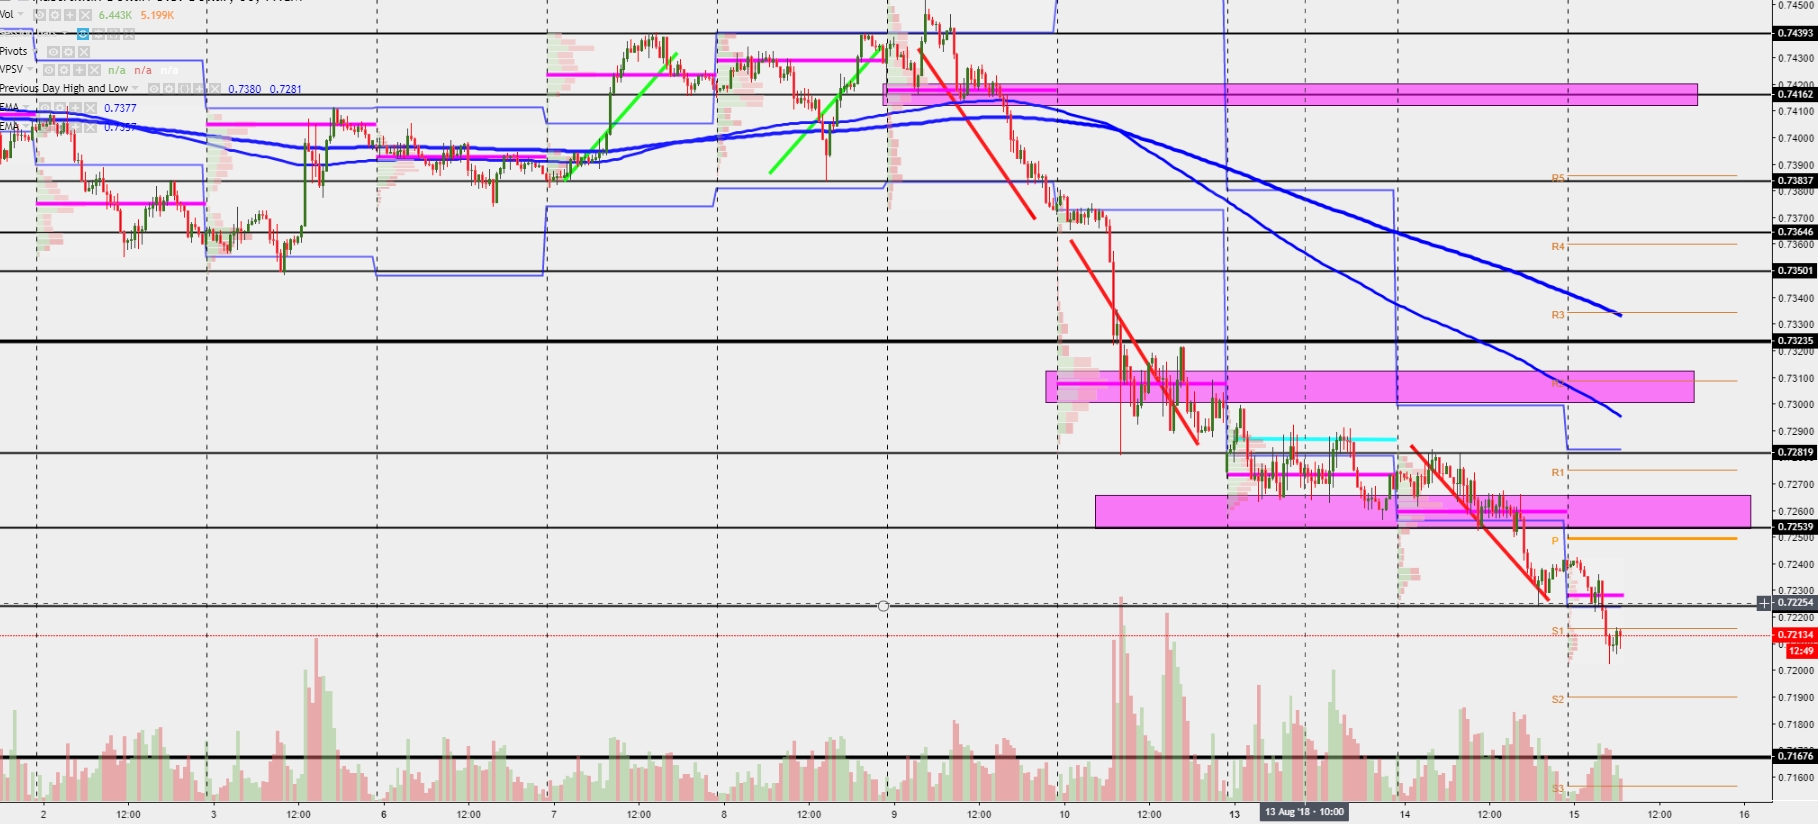
- Strategies aimed at selling on rallies should dominate. The latest breakout of the support at 0.7225 paves the way for a cheaper rate towards the 0.72 round number, ahead of 0.7190 and a major macro support at 0.7165-70 (dates back to Dec 2016). As in the case of the Sterling, sellers are likely to exploit a void area where poor liquidity is expected due to the absence of significant levels of reference. Commercials and market makers sitting on the bid will be looking to exert enough upside pressure for the anticipated slide to play out in an orderly manner nonetheless, as void areas tend to be filled fast on order imbalances, as it’s the risk in today’s Aud/Usd price action. Areas of resistance can be found in close proximity to each other, in a sequence of barely 10-15p from 7225 up to 7255-60 (Tuesday’s PoC). At this point, as in the case of the rest of majors analyzed, the price action bodes fairly disastrous for trend contrarians.
3rd party Ad. Not an offer or recommendation by Investing.com. See disclosure here or
remove ads
.
“Past performance is not a reliable indicator of future performance“
Important Footnotes:
- The only Moving Average to apply in the charts will be the 100-hourly exponential moving average, which will assist us on the overall directional bias of the market.
- The green, red, and aqua lines are utilized to represent the latest Cycles. Markets tend to move in cycles of 3 followed by a period of distribution and/or accumulation. To consider a cycle valid, we need to see a daily move greater than 75% of the 14-period average daily range.
- The magenta rectangles in the chart represent the areas of most interest by trading volume, referred as POC – Point of Control – and should act as walls of bids/offers that may result in price reversals. The rectangles will be drawn as long as the area is not absorbed. The volume profile analysis tracks trading activity over a specified time period at specified price levels. The study reveals dominant and/or significant price levels based on volume. This process allows understanding market opacity.
- The analysis of Volume activity in the chart provides some great insights into the actual buy or sell-side commitment to be engaged into a specific directional movement.
- In the chart we represent Intraday or Macro Support/Resistance levels by drawing them in black colours, via a thinner black line for intraday support/resistance, while the macro levels of support/resistance will be drawn using a thicker black line.
- In a thin blue line we will have the most recent Daily Highs and Lows, which play an important role as areas of support and resistance as well.
3rd party Ad. Not an offer or recommendation by Investing.com. See disclosure here or
remove ads
.
- To reinforce the key area of interest in an attempt to find confluential levels, we will also use Daily Pivot Levels, which include the pivot point (thick orange) and the subsequent 3 levels of support and resistance derived from the pivot calculations.
- The analysis will be conducted from a Top-Down approach by analyzing 2 timeframes. Firstly, we will look at the H4 chart to analyze the big picture, where attention centers around the price action, macro levels, volume analysis and valuations via yield spread. Secondly, we will break down the analysis from a technical perspective through the 30m chart by studying the most likely directional bias based on all the information gathered as well as the levels of major interest for traders.
- The Ultimate Purpose of this report is to equip Global Prime’s existing and future clients with a professional institutional-level daily outlook that can assist one’s trading decisions on a regular basis.
- Technical analysis is subject to Fundamental-led News. Any unexpected news may cause the price to behave erratically in the short term, while still respecting the most distant price references given.
